
Chapter9: Sequences, Probability And Counting Theory
Section9.3: Geometric Sequences
Problem 52SE: Use explicit formulas to give two examples of geometric sequences whose 7thterms are 1024.

Related questions
Question
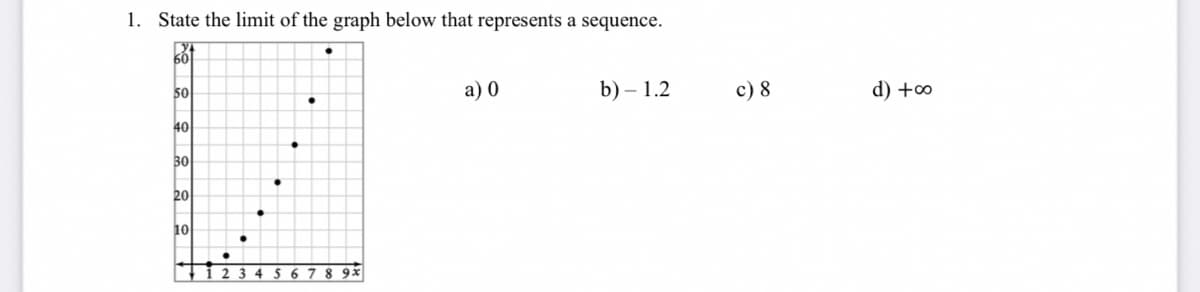
Transcribed Image Text:1. State the limit of the graph below that represents a sequence.
60
50
a) 0
b) – 1.2
c) 8
d) +∞
40
30
20
10
34 567 8 9%
Expert Solution
This question has been solved!
Explore an expertly crafted, step-by-step solution for a thorough understanding of key concepts.

Step by step
Solved in 2 steps with 2 images

Recommended textbooks for you

Algebra & Trigonometry with Analytic Geometry
Algebra
ISBN:
9781133382119
Author:
Swokowski
Publisher:
Cengage
Algebra & Trigonometry with Analytic Geometry
Algebra
ISBN:
9781133382119
Author:
Swokowski
Publisher:
Cengage