1. The data is located in a separate text file here . Copy and paste it from word into the first sheet of an excel document. Rename that sheet to "Data" 2. If the data did not automàtically get separated into columns, use Data->Text to Columns, and separate by comma. 3. Open a second chont
1. The data is located in a separate text file here . Copy and paste it from word into the first sheet of an excel document. Rename that sheet to "Data" 2. If the data did not automàtically get separated into columns, use Data->Text to Columns, and separate by comma. 3. Open a second chont

Computer Networking: A Top-Down Approach (7th Edition)
7th Edition
ISBN:9780133594140
Author:James Kurose, Keith Ross
Publisher:James Kurose, Keith Ross
Chapter1: Computer Networks And The Internet
Section: Chapter Questions
Problem R1RQ: What is the difference between a host and an end system? List several different types of end...

Related questions
Question
Please help me with this please thank you:)
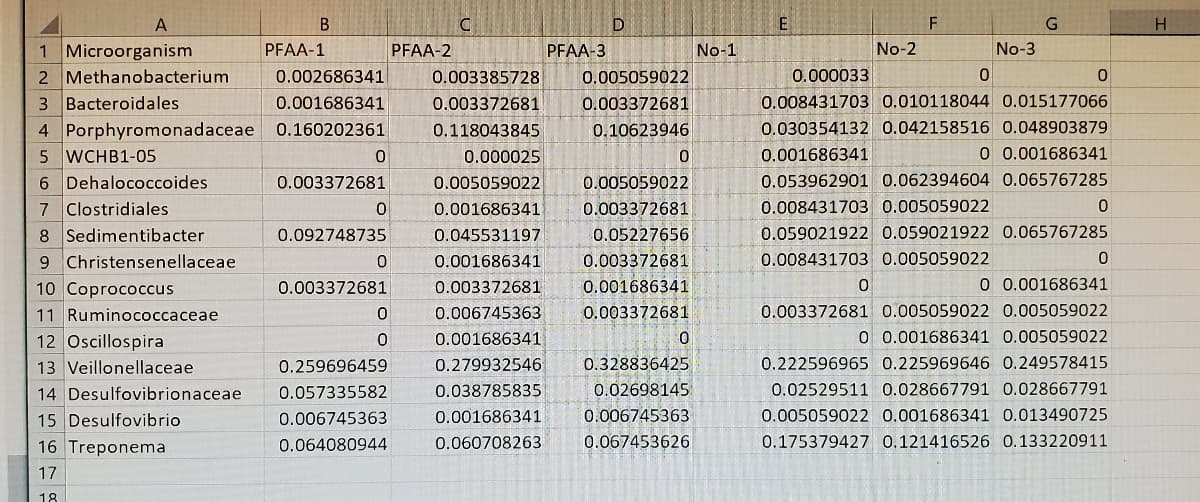
The 1st image is the Data.
Transcribed Image Text:A
G
1 Microorganism
2 Methanobacterium
3 Bacteroidales
4 Porphyromonadaceae 0.160202361
5 WCHB1-05
6 Dehalococcoides
7 Clostridiales
8 Sedimentibacter
9 Christensenellaceae
10 Coprococcus
PFAA-1
PFAA-2
PFAA-3
No-1
No-2
No-3
0.002686341
0.003385728
0.005059022
0.000033
0.001686341
0.003372681
0.003372681
0.008431703 0.010118044 0.015177066
0.118043845
0.10623946
0.030354132 0.042158516 0.048903879
0 0.001686341
0.000025
0.005059022
0.001686341
0.003372681
0.005059022
0.053962901 0.062394604 0.065767285
0.001686341
0.003372681
0.008431703 0.005059022
0.092748735
0.045531197
0.05227656
0.059021922 0.059021922 0.065767285
0.001686341
0.003372681
0.008431703 0.005059022
0.003372681
0.003372681
0.001686341
O 0.001686341
0.003372681 0.005059022 0.005059022
0 0.001686341 0.005059022
11 Ruminococcaceae
0.006745363
0.003372681
12 Oscillospira
0.001686341
13 Veillonellaceae
0.259696459
0.279932546
0.328836425
0.222596965 0.225969646 0.249578415
14 Desulfovibrionaceae
0.057335582
0.038785835
0.02698145
0.02529511 0.028667791 0.028667791
15 Desulfovibrio
0.006745363
0.001686341
0.006745363
0.005059022 0.001686341 0.013490725
16 Treponema
0.064080944
0.060708263
0.067453626
0.175379427 0.121416526 0.133220911
17
18
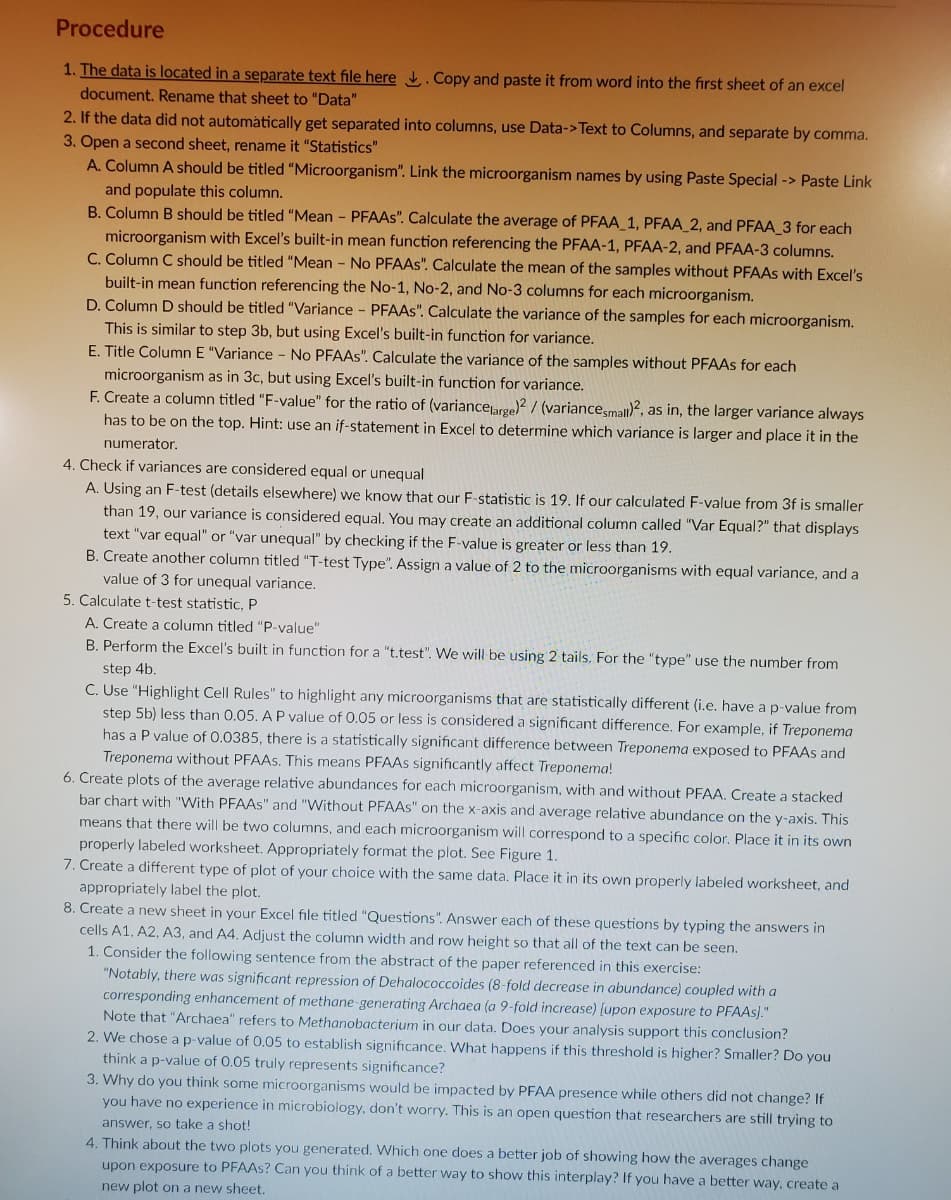
Transcribed Image Text:Procedure
1. The data is located in a separate text file here . Copy and paste it from word into the first sheet of an excel
document. Rename that sheet to "Data"
2. If the data did not automàtically get separated into columns, use Data->Text to Columns, and separate by comma.
3. Open a second sheet, rename it "Statistics"
A. Column A should be titled "Microorganism". Link the microorganism names by using Paste Special -> Paste Link
and populate this column.
B. Column B should be titled "Mean - PFAAS". Calculate the average of PFAA 1, PFAA_2, and PFAA 3 for each
microorganism with Excel's built-in mean function referencing the PFAA-1, PFAA-2, and PFAA-3 columns.
C. Column C should be titled "Mean - No PFAAS". Calculate the mean of the samples without PFAAS with Excel's
built-in mean function referencing the No-1, No-2, and No-3 columns for each microorganism.
D. Column D should be titled "Variance - PFAAS". Calculate the variance of the samples for each microorganism.
This is similar to step 3b, but using Excel's built-in function for variance.
E. Title Column E "Variance - No PFAAS". Calculate the variance of the samples without PFAAS for each
microorganism as in 3c, but using Excel's built-in function for variance.
F. Create a column titled "F-value" for the ratio of (variancearge)2/ (variancesmall), as in, the larger variance always
has to be on the top. Hint: use an if-statement in Excel to determine which variance is larger and place it in the
numerator.
4. Check if variances are considered equal or unequal
A. Using an F-test (details elsewhere) we know that our F-statistic is 19. If our calculated F-value from 3f is smaller
than 19, our variance is considered equal. You may create an additional column called "Var Equal?" that displays
text "var equal" or "var unequal" by checking if the F-value is greater or less than 19.
B. Create another column titled "T-test Type". Assign a value of 2 to the microorganisms with equal variance, and a
value of 3 for unequal variance.
5. Calculate t-test statistic, P
A. Create a column titled "P-value"
B. Perform the Excel's built in function for a "t.test". We will be using 2 tails. For the "type" use the number from
step 4b.
C. Use "Highlight Cell Rules" to highlight any microorganisms that are statistically different (i.e. have a p-value from
step 5b) less than 0.05. A P value of 0.05 or less is considered a significant difference. For example, if Treponema
has a P value of 0.0385, there is a statistically significant difference between Treponema exposed to PFAAS and
Treponema without PFAAS. This means PFAAS significantly affect Treponema!
6. Create plots of the average relative abundances for each microorganism, with and without PFAA. Create a stacked
bar chart with "With PFAAS" and "Without PFAAS" on the x-axis and average relative abundance on the y-axis. This
means that there will be two columns, and each microorganism will correspond to a specific color. Place it in its own
properly labeled worksheet. Appropriately format the plot. See Figure 1.
7. Create a different type of plot of your choice with the same data. Place it in its own properly labeled worksheet, and
appropriately label the plot.
8. Create a new sheet in your Excel file titled "Questions". Answer each of these questions by typing the answers in
cells A1, A2, A3, and A4. Adjust the column width and row height so that all of the text can be seen.
1. Consider the following sentence from the abstract of the paper referenced in this exercise:
"Notably, there was significant repression of Dehalococcoides (8-fold decrease in abundance) coupled with a
corresponding enhancement of methane-generating Archaea (a 9-fold increase) [upon exposure to PFAAS)."
Note that "Archaea" refers to Methanobacterium in our data. Does your analysis support this conclusion?
2. We chose a p-value of 0.05 to establish significance. What happens if this threshold is higher? Smaller? Do you
think a p-value of 0.05 truly represents significance?
3. Why do you think some microorganisms would be impacted by PFAA presence while others did not change? If
you have no experience in microbiology, don't worry. This is an open question that researchers are still trying to
answer, so take a shot!
4. Think about the two plots you generated. Which one does a better job of showing how the averages change
upon exposure to PFAAS? Can you think of a better way to show this interplay? If you have a better way, create a
new plot on a new sheet.
Expert Solution
This question has been solved!
Explore an expertly crafted, step-by-step solution for a thorough understanding of key concepts.

This is a popular solution!

Trending now
This is a popular solution!

Step by step
Solved in 2 steps

Recommended textbooks for you
Computer Networking: A Top-Down Approach (7th Edi…
Computer Engineering
ISBN:
9780133594140
Author:
James Kurose, Keith Ross
Publisher:
PEARSON

Computer Organization and Design MIPS Edition, Fi…
Computer Engineering
ISBN:
9780124077263
Author:
David A. Patterson, John L. Hennessy
Publisher:
Elsevier Science

Network+ Guide to Networks (MindTap Course List)
Computer Engineering
ISBN:
9781337569330
Author:
Jill West, Tamara Dean, Jean Andrews
Publisher:
Cengage Learning
Computer Networking: A Top-Down Approach (7th Edi…
Computer Engineering
ISBN:
9780133594140
Author:
James Kurose, Keith Ross
Publisher:
PEARSON
Computer Organization and Design MIPS Edition, Fi…
Computer Engineering
ISBN:
9780124077263
Author:
David A. Patterson, John L. Hennessy
Publisher:
Elsevier Science
Network+ Guide to Networks (MindTap Course List)
Computer Engineering
ISBN:
9781337569330
Author:
Jill West, Tamara Dean, Jean Andrews
Publisher:
Cengage Learning

Concepts of Database Management
Computer Engineering
ISBN:
9781337093422
Author:
Joy L. Starks, Philip J. Pratt, Mary Z. Last
Publisher:
Cengage Learning

Prelude to Programming
Computer Engineering
ISBN:
9780133750423
Author:
VENIT, Stewart
Publisher:
Pearson Education

Sc Business Data Communications and Networking, T…
Computer Engineering
ISBN:
9781119368830
Author:
FITZGERALD
Publisher:
WILEY