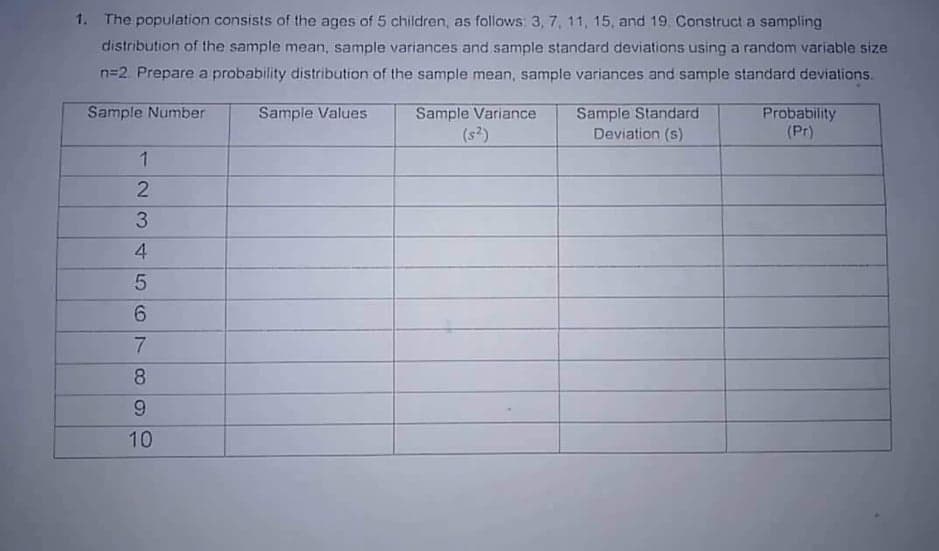
1. The population consists of the ages of 5 children, as follows: 3, 7, 11, 15, and 19. Construct a sampling distribution of the sample mean, sample variances and sample standard deviations using a random variable size n=2. Prepare a probability distribution of the sample mean, sample variances and sample standard deviations.
1. The population consists of the ages of 5 children, as follows: 3, 7, 11, 15, and 19. Construct a sampling distribution of the sample mean, sample variances and sample standard deviations using a random variable size n=2. Prepare a probability distribution of the sample mean, sample variances and sample standard deviations.
Glencoe Algebra 1, Student Edition, 9780079039897, 0079039898, 2018
18th Edition
ISBN:9780079039897
Author:Carter
Publisher:Carter
Chapter10: Statistics
Section10.4: Distributions Of Data
Problem 19PFA
Related questions
Question
Kindly answer please badly needed. Thank you

Transcribed Image Text:1. The population consists of the ages of 5 children, as follows: 3, 7, 11, 15, and 19. Construct a sampling
distribution of the sample mean, sample variances and sample standard deviations using a random variable size
n=2 Prepare a probability distribution of the sample mean, sample variances and sample standard deviations.
Sample Values
Sample Number
1
Sample Variance
(S²)
Sample Standard
Deviation (s)
Probability
(Pr)
2345
6
7
8
9
10

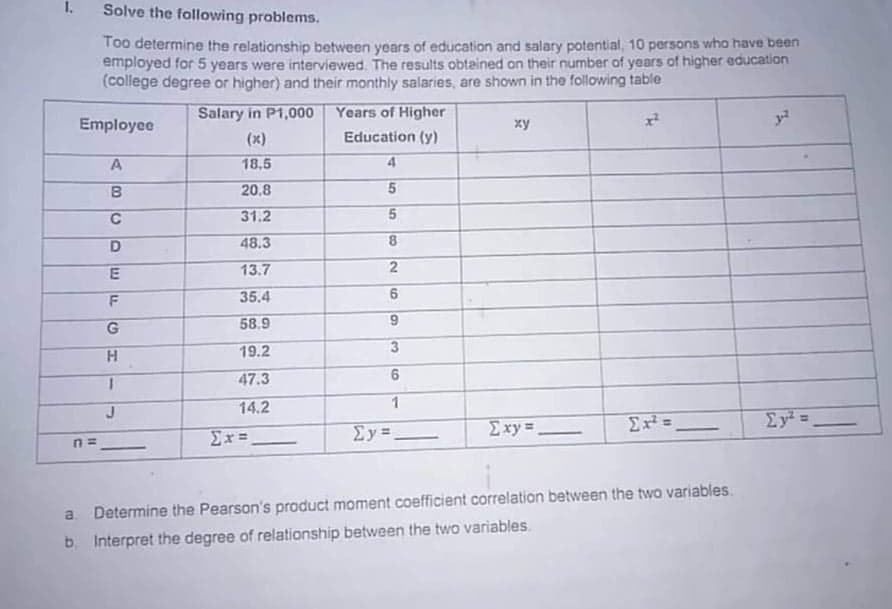
Transcribed Image Text:1.
Solve the following problems.
Too determine the relationship between years of education and salary potential, 10 persons who have been
employed for 5 years were interviewed. The results obtained on their number of years of higher education
(college degree or higher) and their monthly salaries, are shown in the following table
Salary in P1,000
Years of Higher
Employee
xy
y²
(x)
Education (y)
A
18.5
4
B
20,8
5
с
31.2
5
48.3
8
13.7
2
35.4
6
58.9
19.2
47.3
14.2
Ex² =
Σy² =
Exy=
Ex=
Σy=
n=
a. Determine the Pearson's product moment coefficient correlation between the two variables.
b. Interpret the degree of relationship between the two variables.
CDEFG
H
1
6
3
6
1
Expert Solution
This question has been solved!
Explore an expertly crafted, step-by-step solution for a thorough understanding of key concepts.
Step by step
Solved in 3 steps

Recommended textbooks for you

Glencoe Algebra 1, Student Edition, 9780079039897…
Algebra
ISBN:
9780079039897
Author:
Carter
Publisher:
McGraw Hill

Glencoe Algebra 1, Student Edition, 9780079039897…
Algebra
ISBN:
9780079039897
Author:
Carter
Publisher:
McGraw Hill