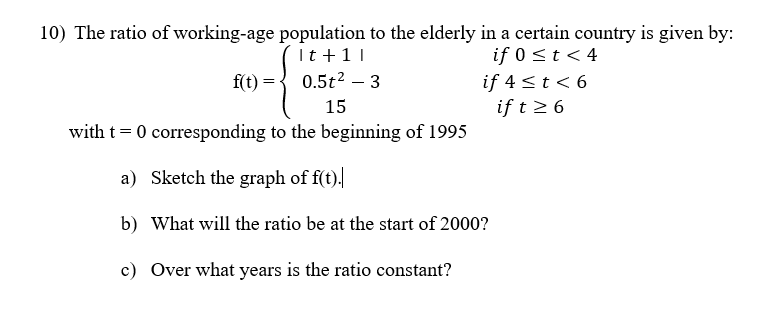
10) The ratio of working-age population to the elderly in a certain country is given by: It + 11 if 0 ≤ t < 4 f(t) 0.5t²3 15 with t = 0 corresponding to the beginning of 1995 a) Sketch the graph of f(t). b) What will the ratio be at the start of 2000? c) Over what years is the ratio constant? if 4 < t < 6 if t≥ 6
10) The ratio of working-age population to the elderly in a certain country is given by: It + 11 if 0 ≤ t < 4 f(t) 0.5t²3 15 with t = 0 corresponding to the beginning of 1995 a) Sketch the graph of f(t). b) What will the ratio be at the start of 2000? c) Over what years is the ratio constant? if 4 < t < 6 if t≥ 6

Algebra & Trigonometry with Analytic Geometry
13th Edition
ISBN:9781133382119
Author:Swokowski
Publisher:Swokowski
Chapter4: Polynomial And Rational Functions
Section: Chapter Questions
Problem 5T

Related questions
Question
Transcribed Image Text:10) The ratio of working-age population to the elderly in a certain country is given by:
It + 11
if 0 ≤ t < 4
f(t)
0.5t²3
15
with t = 0 corresponding to the beginning of 1995
a)
Sketch the graph of f(t).
b) What will the ratio be at the start of 2000?
c) Over what years is the ratio constant?
if 4 < t < 6
if t≥ 6
Expert Solution
This question has been solved!
Explore an expertly crafted, step-by-step solution for a thorough understanding of key concepts.

Step by step
Solved in 2 steps with 2 images

Recommended textbooks for you
Algebra & Trigonometry with Analytic Geometry
Algebra
ISBN:
9781133382119
Author:
Swokowski
Publisher:
Cengage

Intermediate Algebra
Algebra
ISBN:
9781285195728
Author:
Jerome E. Kaufmann, Karen L. Schwitters
Publisher:
Cengage Learning
Algebra & Trigonometry with Analytic Geometry
Algebra
ISBN:
9781133382119
Author:
Swokowski
Publisher:
Cengage
Intermediate Algebra
Algebra
ISBN:
9781285195728
Author:
Jerome E. Kaufmann, Karen L. Schwitters
Publisher:
Cengage Learning