10.0 7.0 5.0 0.0 -5.0 -8.0 -10.0 12.0 6.0 0.0 -6.0 -12.0 0 2 4 Time (t/s) position m 5 velocity m/s 8 PART 7 The position-time graph shows the motion of the man during three different intervals of time. c. Find the velocity for the time interval 5 to 8 seconds. d. Using the velocities calculated in a, b and c Paste a screenshot the velocity time granh in
10.0 7.0 5.0 0.0 -5.0 -8.0 -10.0 12.0 6.0 0.0 -6.0 -12.0 0 2 4 Time (t/s) position m 5 velocity m/s 8 PART 7 The position-time graph shows the motion of the man during three different intervals of time. c. Find the velocity for the time interval 5 to 8 seconds. d. Using the velocities calculated in a, b and c Paste a screenshot the velocity time granh in

Related questions
Question
USE LATEX
Transcribed Image Text:10.0
7.0
5.0
0.0
-5.0
-8.0
-10.0
12.0
6.0
0.0
-6.0
-12.0
0
0
2
4
Time (t/s)
Time (t/s)
position m
5
velocity m/s
6
8
8
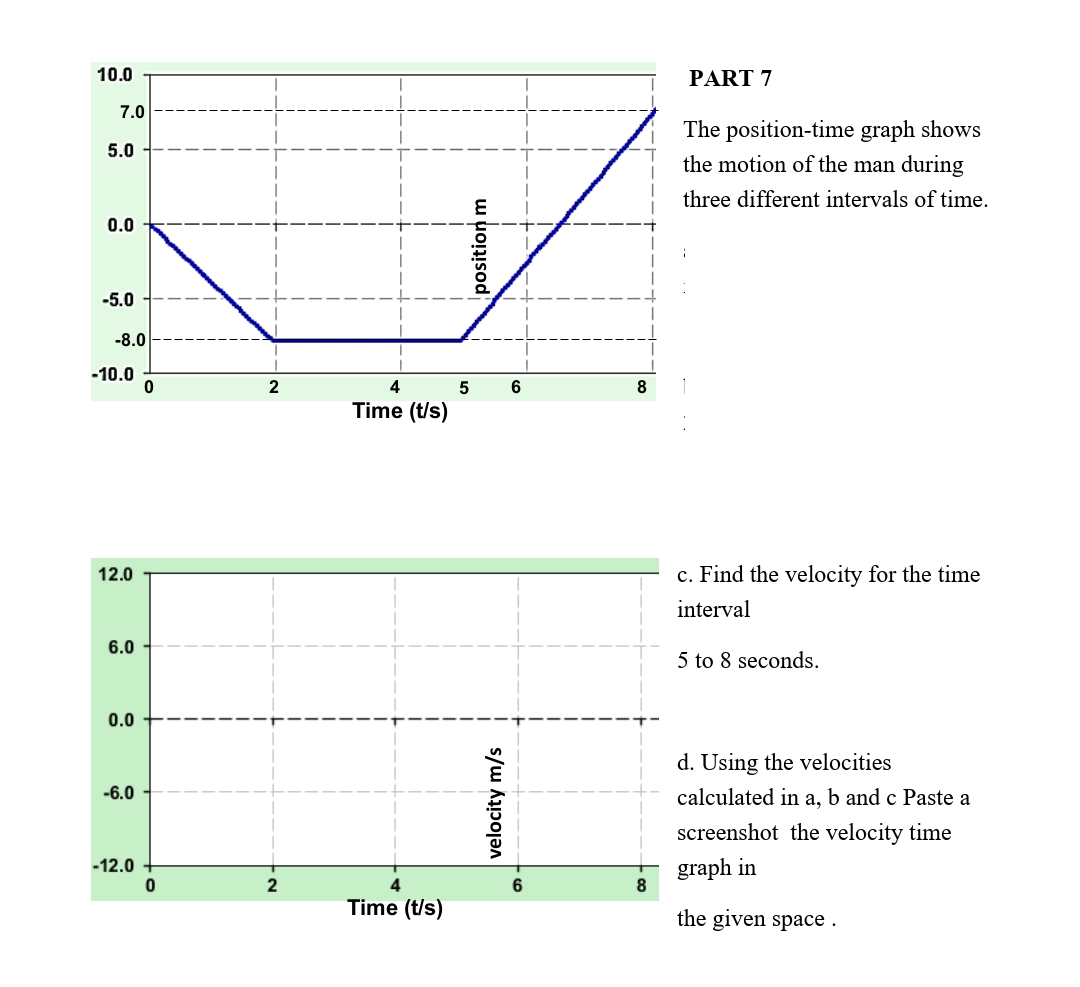
PART 7
The position-time graph shows
the motion of the man during
three different intervals of time.
c. Find the velocity for the time
interval
5 to 8 seconds.
d. Using the velocities
calculated in a, b and c Paste a
screenshot the velocity time
graph in
the given space.
Expert Solution
This question has been solved!
Explore an expertly crafted, step-by-step solution for a thorough understanding of key concepts.

Step by step
Solved in 3 steps with 3 images
