11. The table of values below shows the rate of oil consumption in gallons per minute at selected time intervals from t = 0 to t = 12. Using a left Riemann sum with 5 subintervals estimate the total amount of oil consumed in that time interval. Give your answer correct to 1 decimal place. 0 2 5 7 11 12 f(x) 7 4.0 3.2 2.2 1.6 1 X
11. The table of values below shows the rate of oil consumption in gallons per minute at selected time intervals from t = 0 to t = 12. Using a left Riemann sum with 5 subintervals estimate the total amount of oil consumed in that time interval. Give your answer correct to 1 decimal place. 0 2 5 7 11 12 f(x) 7 4.0 3.2 2.2 1.6 1 X

Trigonometry (MindTap Course List)
10th Edition
ISBN:9781337278461
Author:Ron Larson
Publisher:Ron Larson
Chapter6: Topics In Analytic Geometry
Section: Chapter Questions
Problem 33CT

Related questions
Question
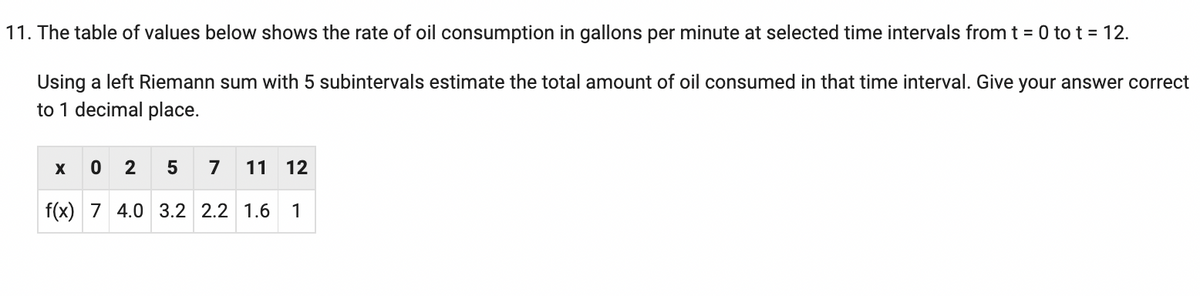
Transcribed Image Text:11. The table of values below shows the rate of oil consumption in gallons per minute at selected time intervals from t = 0 to t = 12.
Using a left Riemann sum with 5 subintervals estimate the total amount of oil consumed in that time interval. Give your answer correct
to 1 decimal place.
0 2
7 11 12
f(x) 7 4.0 3.2 2.2 1.6 1
X
5
Expert Solution
This question has been solved!
Explore an expertly crafted, step-by-step solution for a thorough understanding of key concepts.

This is a popular solution!

Trending now
This is a popular solution!

Step by step
Solved in 2 steps

Recommended textbooks for you
Trigonometry (MindTap Course List)
Trigonometry
ISBN:
9781337278461
Author:
Ron Larson
Publisher:
Cengage Learning


Algebra & Trigonometry with Analytic Geometry
Algebra
ISBN:
9781133382119
Author:
Swokowski
Publisher:
Cengage
Trigonometry (MindTap Course List)
Trigonometry
ISBN:
9781337278461
Author:
Ron Larson
Publisher:
Cengage Learning
Algebra & Trigonometry with Analytic Geometry
Algebra
ISBN:
9781133382119
Author:
Swokowski
Publisher:
Cengage