12. The area under the velocity vs time graph is supposed to be equal to the distance traveled along a straight line. Displacement = final position - initial position Distance: the distance traveled along the actual path. Since the average velocity = displacement (distance traveled along a straight line) / given time interval v = d/t d = vt Set the position of the man at -10.0 m, the velocity equal to 5 m's and the acceleration to 0.0. Run the simulation until the Moving Man hits the wall. What is the area under the velocity curve when the man reaches the +10 m mark? (You want velocity curve and the horizontal time axis. Realizing what kind of shape it is may help you calculate the area). Insert below a screen shot of the simulation for above description and your worksheet which shows how you obtain final answer for each question 39 seconds
12. The area under the velocity vs time graph is supposed to be equal to the distance traveled along a straight line. Displacement = final position - initial position Distance: the distance traveled along the actual path. Since the average velocity = displacement (distance traveled along a straight line) / given time interval v = d/t d = vt Set the position of the man at -10.0 m, the velocity equal to 5 m's and the acceleration to 0.0. Run the simulation until the Moving Man hits the wall. What is the area under the velocity curve when the man reaches the +10 m mark? (You want velocity curve and the horizontal time axis. Realizing what kind of shape it is may help you calculate the area). Insert below a screen shot of the simulation for above description and your worksheet which shows how you obtain final answer for each question 39 seconds

Related questions
Question
I need help with this
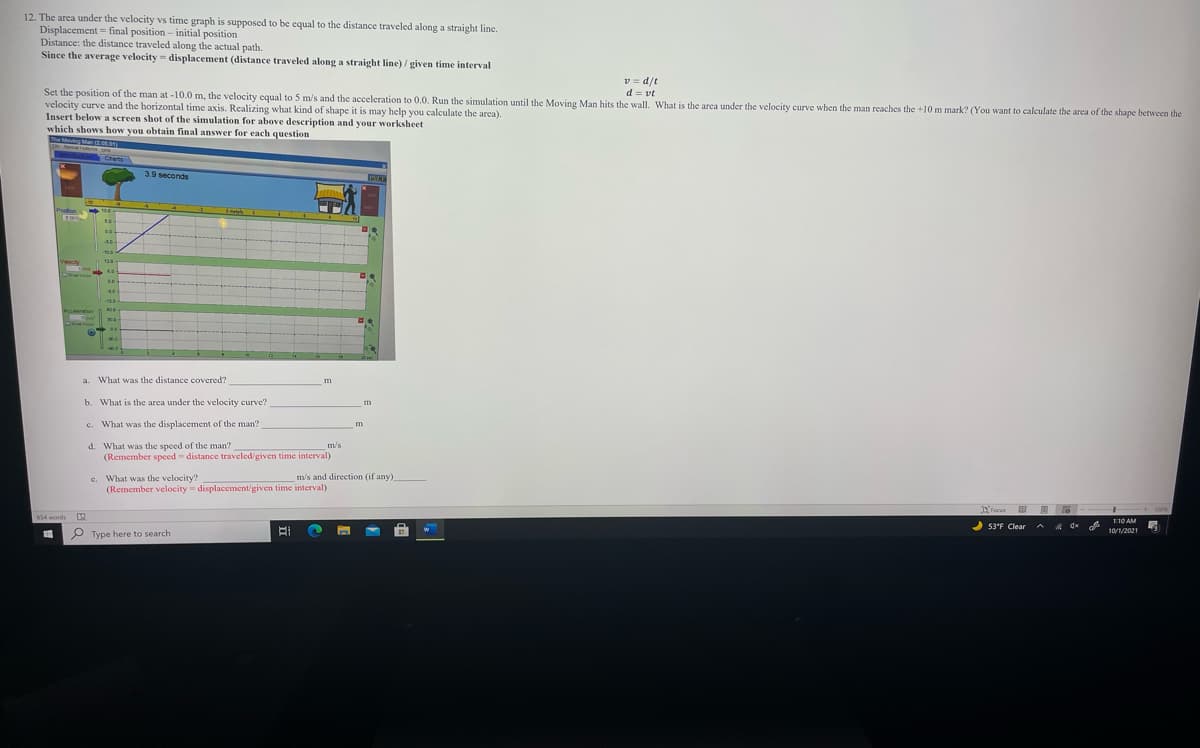
Transcribed Image Text:12. The area under the velocity vs time graph is supposed to be equal to the distance traveled along a straight line.
Displacement = final position – initial position
Distance: the distance traveled along the actual path.
Since the average velocity = displacement (distance traveled along a straight line) / given time interval
v = d/t
d = vt
Set the position of the man at -10.0 m, the velocity equal to 5 m/s and the acceleration to 0.0. Run the simulation until the Moving Man hits the wall. What is the area under the velocity curve when the man reaches the +10 m mark? (You want to calculate the area of the shape between the
velocity curve and the horizontal time axis. Realizing what kind of shape it is may help you calculate the area).
Insert below a screen shot of the simulation for above description and your worksheet
which shows how you obtain final answer for each question
McMoving Man (200
Chans
3.9 seconds
Postion
100-
-100
a. What was the distance covered?
m
b. What is the area under the velocity curve?
m.
c. What was the displacement of the man?
m
d. What was the speed of the man?
(Remember speed - distance traveled/given time interval)
m/s
c. What was the velocity?
(Remember velocity displacement/given time interval)
m/s and direction (if any)
DFocus
854 words D
1:10 AM
53'F Clear
10/1/2021
P Type here to search
Expert Solution
This question has been solved!
Explore an expertly crafted, step-by-step solution for a thorough understanding of key concepts.

This is a popular solution!

Trending now
This is a popular solution!

Step by step
Solved in 2 steps
