13. Table 1 lists enrollment in US degree-granting instutions for both undergraduate and graduate students. A linear regression model for undergraduate enrollment is 14. y- 0.17x + 10.1 where x represents years since 1995 and y is the undergraduate enrollment in millions of students Table 1: Fall Undergraduate and Graduate Enrollment (millions of students) Year Undergraduate Graduate 1995 10.48 1.34 2000 2005 2010 10.60 1.38 11.96 1.59 12.23 1.73 2015 13.16 1.85 2020 14.96 2.19 a. Draw a scatter plot of the undergraduate enrollment data and a graph of the model on the same axes. b. Predict the undergraduate student enrollment in 2024 (to the nearest 100,000) c. Interpret the slope of the model.
13. Table 1 lists enrollment in US degree-granting instutions for both undergraduate and graduate students. A linear regression model for undergraduate enrollment is 14. y- 0.17x + 10.1 where x represents years since 1995 and y is the undergraduate enrollment in millions of students Table 1: Fall Undergraduate and Graduate Enrollment (millions of students) Year Undergraduate Graduate 1995 10.48 1.34 2000 2005 2010 10.60 1.38 11.96 1.59 12.23 1.73 2015 13.16 1.85 2020 14.96 2.19 a. Draw a scatter plot of the undergraduate enrollment data and a graph of the model on the same axes. b. Predict the undergraduate student enrollment in 2024 (to the nearest 100,000) c. Interpret the slope of the model.

College Algebra
7th Edition
ISBN:9781305115545
Author:James Stewart, Lothar Redlin, Saleem Watson
Publisher:James Stewart, Lothar Redlin, Saleem Watson
Chapter1: Equations And Graphs
Section: Chapter Questions
Problem 10T: Olympic Pole Vault The graph in Figure 7 indicates that in recent years the winning Olympic men’s...

Related questions
Question
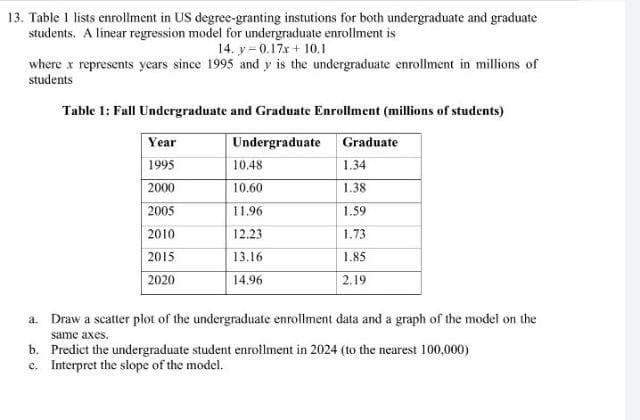
Transcribed Image Text:13. Table 1 lists enrollment in US degree-granting instutions for both undergraduate and graduate
students. A linear regression model for undergraduate enrollment is
14. y= 0.17x + 10.1
where x represents years since 1995 and y is the undergraduate enrollment in millions of
students
Table 1: Fall Undergraduate and Graduate Enrollment (millions of students)
Year
Undergraduate Graduate
1995
10.48
1.34
2000
10.60
1.38
2005
11.96
1.59
2010
12.23
1.73
2015
13.16
1.85
2020
14.96
2.19
a. Draw a scatter plot of the undergraduate enrollment data and a graph of the model on the
same axes.
b. Predict the undergraduate student enrollment in 2024 (to the nearest 100,000)
c. Interpret the slope of the model.
Expert Solution
This question has been solved!
Explore an expertly crafted, step-by-step solution for a thorough understanding of key concepts.

This is a popular solution!

Trending now
This is a popular solution!

Step by step
Solved in 2 steps with 2 images

Recommended textbooks for you
College Algebra
Algebra
ISBN:
9781305115545
Author:
James Stewart, Lothar Redlin, Saleem Watson
Publisher:
Cengage Learning

Algebra & Trigonometry with Analytic Geometry
Algebra
ISBN:
9781133382119
Author:
Swokowski
Publisher:
Cengage

Functions and Change: A Modeling Approach to Coll…
Algebra
ISBN:
9781337111348
Author:
Bruce Crauder, Benny Evans, Alan Noell
Publisher:
Cengage Learning
College Algebra
Algebra
ISBN:
9781305115545
Author:
James Stewart, Lothar Redlin, Saleem Watson
Publisher:
Cengage Learning
Algebra & Trigonometry with Analytic Geometry
Algebra
ISBN:
9781133382119
Author:
Swokowski
Publisher:
Cengage
Functions and Change: A Modeling Approach to Coll…
Algebra
ISBN:
9781337111348
Author:
Bruce Crauder, Benny Evans, Alan Noell
Publisher:
Cengage Learning

Algebra and Trigonometry (MindTap Course List)
Algebra
ISBN:
9781305071742
Author:
James Stewart, Lothar Redlin, Saleem Watson
Publisher:
Cengage Learning