13. Which graph could represent an exponential relation? a. b. 14. Which statement is true about the graph of the exponential relationship y = 120(3)*? a. The graph starts at the origin. b. The maximum value is 120. c. There is no x-intercept. d. The graph decreases from left to right. 15. Which statement is true about the graph of the exponential relationship y = 240(3)*? c. The x-intercept is 3. d. The y-intercept is 1. a. The graph starts at the origin. b. The maximum value is 240. 16. You have been given $1000 Canada Savings Bonds that will earn 9.5% interest, compounded annually. Based on this information, which equation represents the value of the bonds? a. A- 1000(1.95)" c. A- 100 (1.095)* b. A- 1000(1.095)" d. A-4 x 1000(1.095) 17. Consider the table below. 2 3946.2 3354.3 3 4 y 2851.1 2423.5 2059.9 The table shows: (a) Linear data (b) Quadratic data c. exponential data d. none of the above 18. Consider the table below. 2 4 5 y 4594.4 4546.2 4498.0 4449.8 4401.6 The second differences are (a) Constant or nearly constant (b) Obviously changing c. 0 d. none of the above 19. Consider the table below. 10 Y| -177.7 15 20 -6202.4 -14 637.4 -25 482.4 25 30 -38737.4 The best trend line for the data in the table would be: (a) A straight line (b) A rapidly increasing curve c. a parabola d. none of the above
13. Which graph could represent an exponential relation? a. b. 14. Which statement is true about the graph of the exponential relationship y = 120(3)*? a. The graph starts at the origin. b. The maximum value is 120. c. There is no x-intercept. d. The graph decreases from left to right. 15. Which statement is true about the graph of the exponential relationship y = 240(3)*? c. The x-intercept is 3. d. The y-intercept is 1. a. The graph starts at the origin. b. The maximum value is 240. 16. You have been given $1000 Canada Savings Bonds that will earn 9.5% interest, compounded annually. Based on this information, which equation represents the value of the bonds? a. A- 1000(1.95)" c. A- 100 (1.095)* b. A- 1000(1.095)" d. A-4 x 1000(1.095) 17. Consider the table below. 2 3946.2 3354.3 3 4 y 2851.1 2423.5 2059.9 The table shows: (a) Linear data (b) Quadratic data c. exponential data d. none of the above 18. Consider the table below. 2 4 5 y 4594.4 4546.2 4498.0 4449.8 4401.6 The second differences are (a) Constant or nearly constant (b) Obviously changing c. 0 d. none of the above 19. Consider the table below. 10 Y| -177.7 15 20 -6202.4 -14 637.4 -25 482.4 25 30 -38737.4 The best trend line for the data in the table would be: (a) A straight line (b) A rapidly increasing curve c. a parabola d. none of the above

Algebra and Trigonometry (MindTap Course List)
4th Edition
ISBN:9781305071742
Author:James Stewart, Lothar Redlin, Saleem Watson
Publisher:James Stewart, Lothar Redlin, Saleem Watson
Chapter1: Equations And Graphs
Section1.2: Graphs Of Equations In Two Variables; Circles
Problem 111E

Related questions
Question
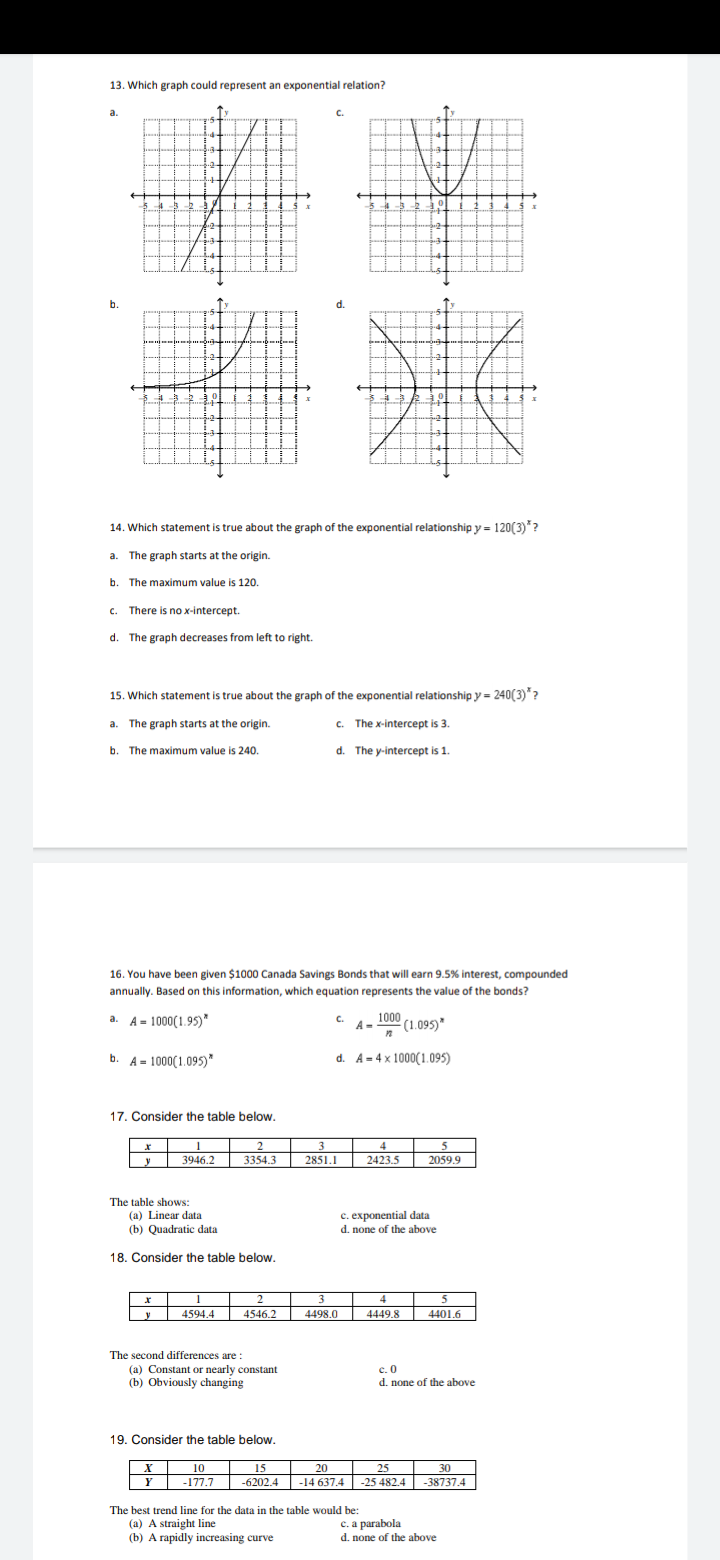
Transcribed Image Text:13. Which graph could represent an exponential relation?
a.
C.
b.
d.
14. Which statement is true about the graph of the exponential relationship y = 120(3)* ?
a. The graph starts at the origin.
b. The maximum value is 120.
c. There is no x-intercept.
d. The graph decreases from left to right.
15. Which statement is true about the graph of the exponential relationship y = 240(3)*?
a. The graph starts at the origin.
c. The x-intercept is 3.
b. The maximum value is 240.
d. The y-intercept is 1.
16. You have been given $1000 Canada Savings Bonds that will earn 9.5% interest, compounded
annually. Based on this information, which equation represents the value of the bonds?
a. A - 1000(1.95)*
C.
A-
1000
(1.095)*
b.
A = 1000(1.095)*
d. A=4x 1000(1.095)
17. Consider the table below.
2
3
4
5
3946.2
3354.3
2423.5
2059.9
y
2851.1
The table shows:
(a) Linear data
(b) Quadratic data
c. exponential data
d. none of the above
18. Consider the table below.
3
4
5
4594.4
4546.2
4498.0
4449.8
4401.6
The second differences are :
(a) Constant or nearly constant
(b) Obviously changing
с. 0
d. none of the above
19. Consider the table below.
10
-177.7
15
20
25
30
-6202.4
-14 637.4
-25 482.4
38737.4
The best trend line for the data in the table would be:
(a) A straight line
(b) A rapidly increasing curve
c. a parabola
d. none of the above
Expert Solution
This question has been solved!
Explore an expertly crafted, step-by-step solution for a thorough understanding of key concepts.

This is a popular solution!

Trending now
This is a popular solution!

Step by step
Solved in 3 steps

Recommended textbooks for you
Algebra and Trigonometry (MindTap Course List)
Algebra
ISBN:
9781305071742
Author:
James Stewart, Lothar Redlin, Saleem Watson
Publisher:
Cengage Learning

Big Ideas Math A Bridge To Success Algebra 1: Stu…
Algebra
ISBN:
9781680331141
Author:
HOUGHTON MIFFLIN HARCOURT
Publisher:
Houghton Mifflin Harcourt

Functions and Change: A Modeling Approach to Coll…
Algebra
ISBN:
9781337111348
Author:
Bruce Crauder, Benny Evans, Alan Noell
Publisher:
Cengage Learning
Algebra and Trigonometry (MindTap Course List)
Algebra
ISBN:
9781305071742
Author:
James Stewart, Lothar Redlin, Saleem Watson
Publisher:
Cengage Learning
Big Ideas Math A Bridge To Success Algebra 1: Stu…
Algebra
ISBN:
9781680331141
Author:
HOUGHTON MIFFLIN HARCOURT
Publisher:
Houghton Mifflin Harcourt
Functions and Change: A Modeling Approach to Coll…
Algebra
ISBN:
9781337111348
Author:
Bruce Crauder, Benny Evans, Alan Noell
Publisher:
Cengage Learning

Algebra & Trigonometry with Analytic Geometry
Algebra
ISBN:
9781133382119
Author:
Swokowski
Publisher:
Cengage