14. The formula for Chi Square (x) is: X = chi squared x² = E (0; – E;)² E; O; = observed value E = expected value Chi-square Table. Probabilities a 0.95 0.90 0.70 0.50 0.30 0.20 0.10 0.05 0.01 Df 1 0.004 0.016 0.15 0.46 1.07 1.64 2.71 3.84 6.64 0.10 0.21 1.39 1.39 2.41 3.22 4.61 5.99 9.21 3 0.35 0.58 1.42 2.37 3.67 4.64 6.25 7.82 11.35 4 0.71 1.06 2.20 3.36 4.88 5.99 7.78 9.49 13.28 1.15 1.61 3.00 4.35 6.06 7.29 9.24 11.07 15.09 1.64 2.20 3.83 5.35 7.23 8.56 10.65 12.59 16.81 7 2.17 2.83 4.67 6.35 8.38 9.80 12.02 14.07 18.48 8. 2.73 3.49 5.53 7.34 9.52 11.03 13.36 15.51 20.09 9 3.33 4.17 6.39 8.34 10.66 12.24 14.68 16.92 21.67 Chi-Square Value (X?). If the observed had equaled the expected, the value would have been zero. Thus, a small X value indicates that the observed and expected ratios are in close agreement. Chi-Square Test d/E Expected Frequency (E) Seed Phenotype Class Observed Deviation (d=0-E) Frequency (0) Corn Rice Mongo Squash d2 What can you conclude based on the value of the computed Chi-square? How can you relate the two principles of Mendel to Chi-Square Values?
14. The formula for Chi Square (x) is: X = chi squared x² = E (0; – E;)² E; O; = observed value E = expected value Chi-square Table. Probabilities a 0.95 0.90 0.70 0.50 0.30 0.20 0.10 0.05 0.01 Df 1 0.004 0.016 0.15 0.46 1.07 1.64 2.71 3.84 6.64 0.10 0.21 1.39 1.39 2.41 3.22 4.61 5.99 9.21 3 0.35 0.58 1.42 2.37 3.67 4.64 6.25 7.82 11.35 4 0.71 1.06 2.20 3.36 4.88 5.99 7.78 9.49 13.28 1.15 1.61 3.00 4.35 6.06 7.29 9.24 11.07 15.09 1.64 2.20 3.83 5.35 7.23 8.56 10.65 12.59 16.81 7 2.17 2.83 4.67 6.35 8.38 9.80 12.02 14.07 18.48 8. 2.73 3.49 5.53 7.34 9.52 11.03 13.36 15.51 20.09 9 3.33 4.17 6.39 8.34 10.66 12.24 14.68 16.92 21.67 Chi-Square Value (X?). If the observed had equaled the expected, the value would have been zero. Thus, a small X value indicates that the observed and expected ratios are in close agreement. Chi-Square Test d/E Expected Frequency (E) Seed Phenotype Class Observed Deviation (d=0-E) Frequency (0) Corn Rice Mongo Squash d2 What can you conclude based on the value of the computed Chi-square? How can you relate the two principles of Mendel to Chi-Square Values?

A First Course in Probability (10th Edition)
10th Edition
ISBN:9780134753119
Author:Sheldon Ross
Publisher:Sheldon Ross
Chapter1: Combinatorial Analysis
Section: Chapter Questions
Problem 1.1P: a. How many different 7-place license plates are possible if the first 2 places are for letters and...

Related questions
Question
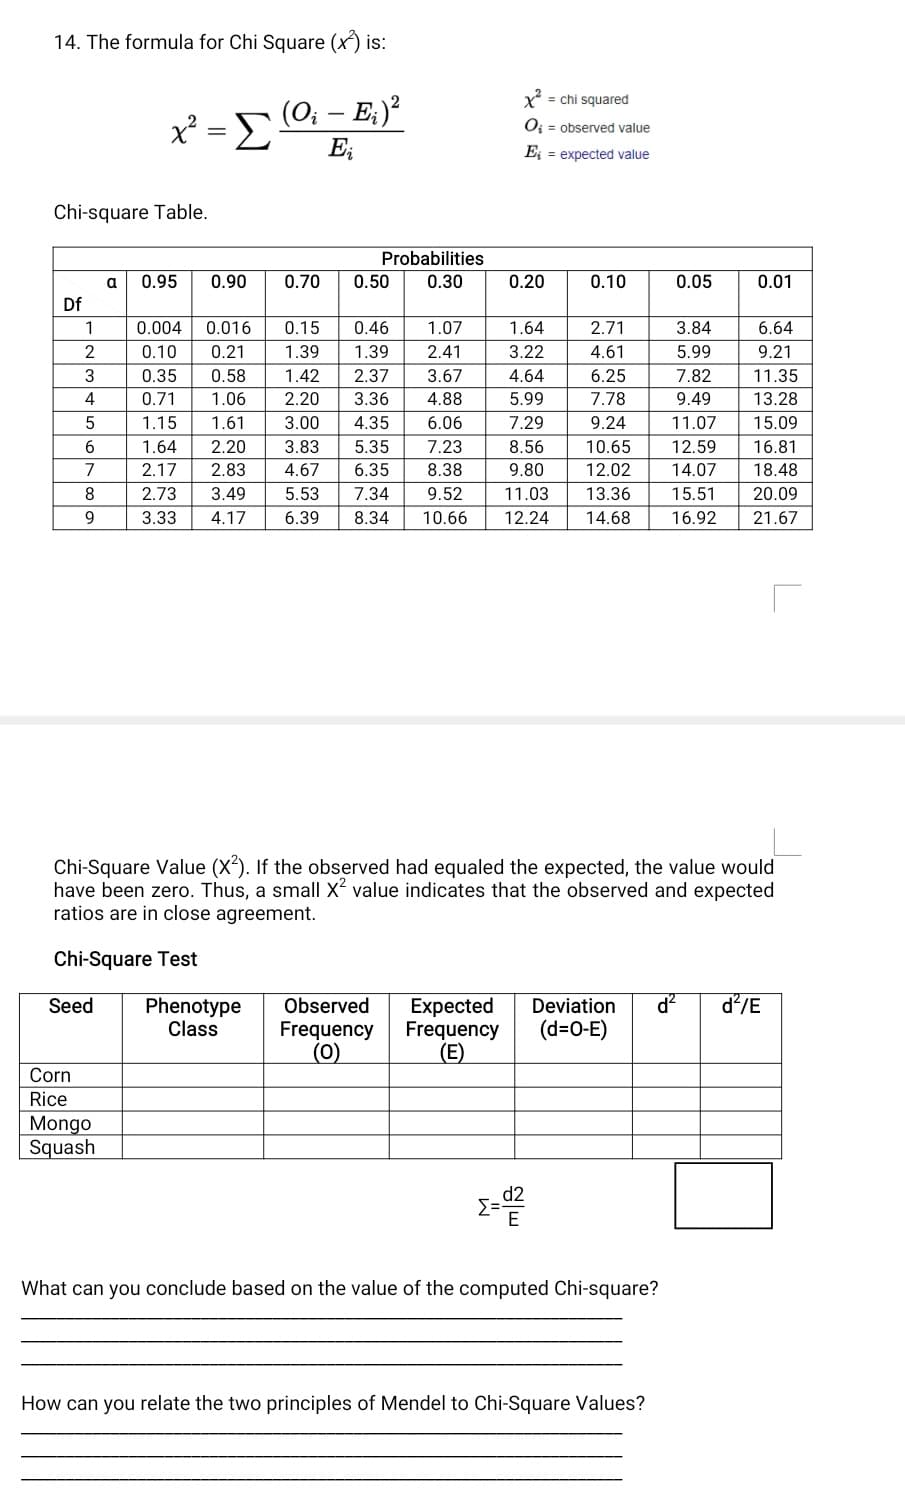
Transcribed Image Text:14. The formula for Chi Square (x) is:
x² ==
(O; – E;)?
X = chi squared
O; = observed value
-
E;
E¡ = expected value
Chi-square Table.
Probabilities
a
0.95
0.90
0.70
0.50
0.30
0.20
0.10
0.05
0.01
Df
1
0.004
0.016
0.15
0.46
1.07
1.64
2.71
3.84
6.64
2
0.10
0.21
1.39
1.39
2.41
3.22
4.61
5.99
9.21
3
0.35
0.58
1.42
2.37
3.67
4.64
6.25
7.82
11.35
4
0.71
1.06
2.20
3.36
4.88
5.99
7.78
9.49
13.28
5
1.15
1.61
3.00
4.35
6.06
7.29
9.24
11.07
15.09
6.
1.64
2.20
3.83
5.35
7.23
8.56
10.65
12.59
16.81
7
2.17
2.83
4.67
6.35
8.38
9.80
12.02
14.07
18.48
8.
2.73
3.49
5.53
7.34
9.52
11.03
13.36
15.51
20.09
9
3.33
4.17
6.39
8.34
10.66
12.24
14.68
16.92
21.67
Chi-Square Value (X). If the observed had equaled the expected, the value would
have been zero. Thus, a small X value indicates that the observed and expected
ratios are in close agreement.
Chi-Square Test
Seed
d?
d²/E
Phenotype
Class
Expected
Frequency
(E)
Observed
Deviation
(d=0-E)
Frequency
(0)
Corn
Rice
Mongo
Squash
d2
Σ
E
What can you conclude based on the value of the computed Chi-square?
How can you relate the two principles of Mendel to Chi-Square Values?
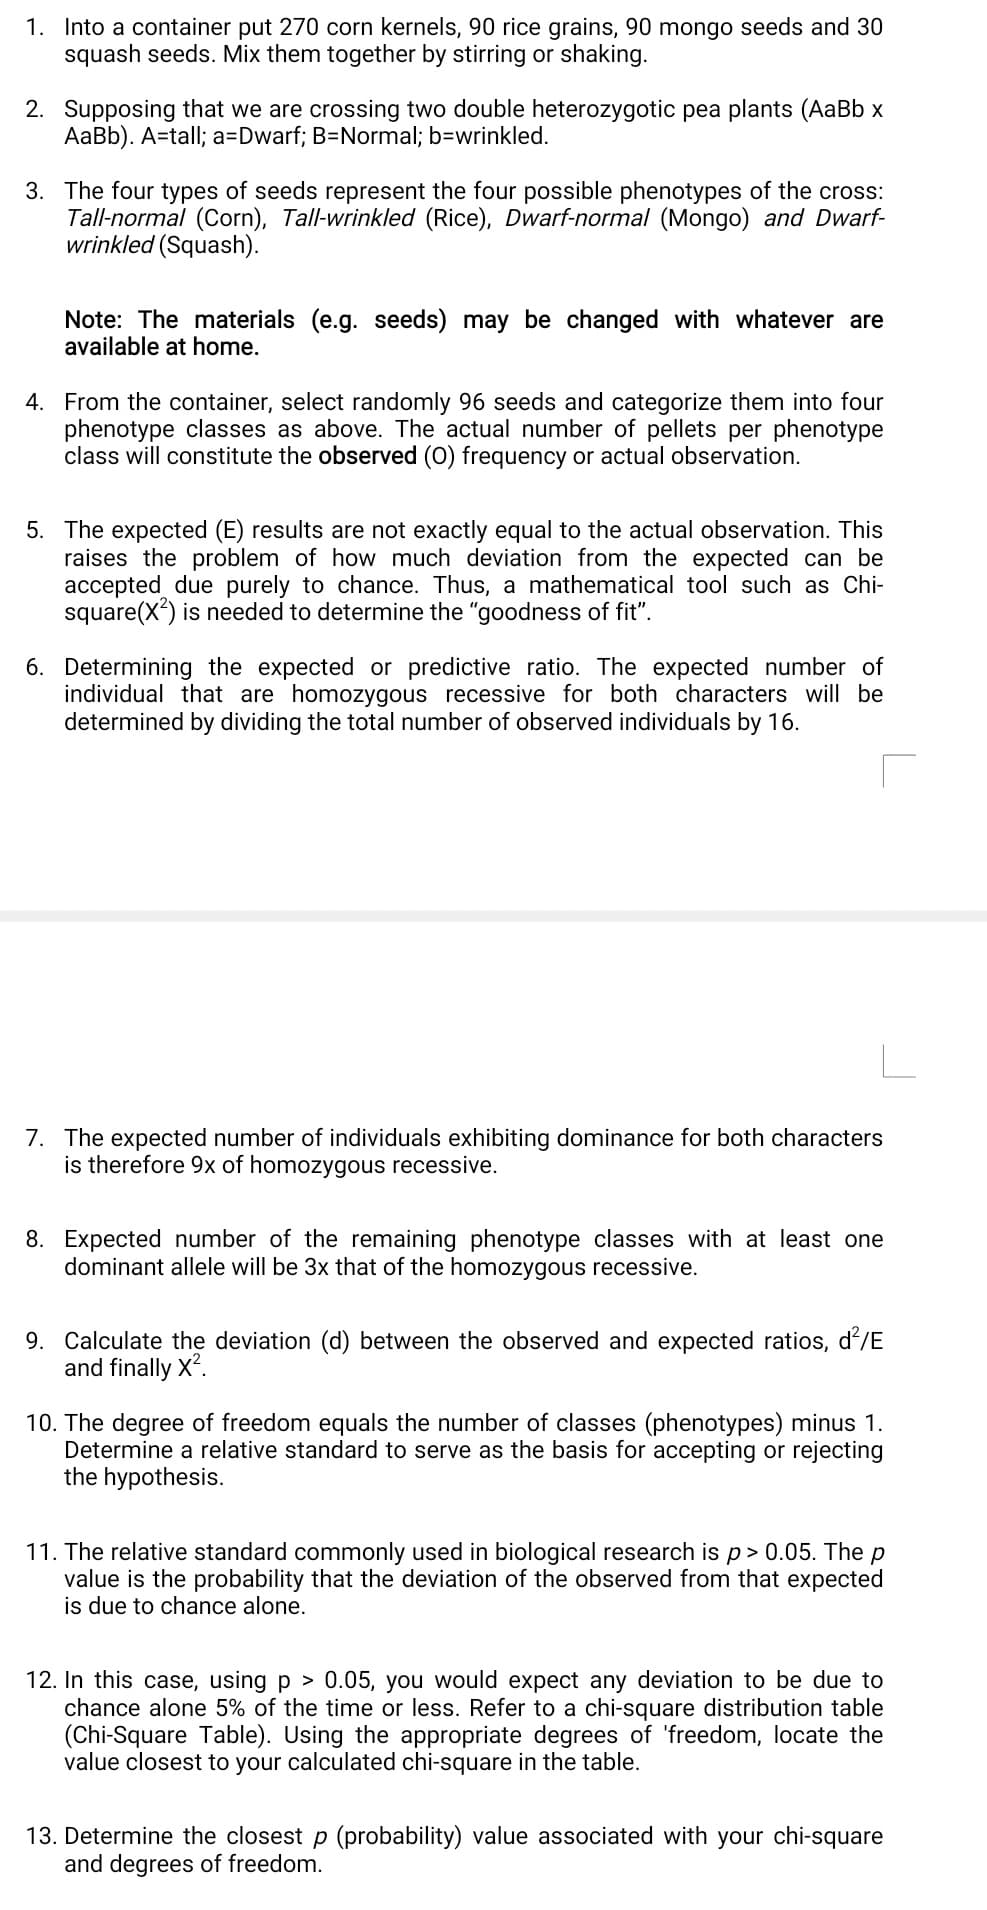
Transcribed Image Text:1. Into a container put 270 corn kernels, 90 rice grains, 90 mongo seeds and 30
squash seeds. Mix them together by stirring or shaking.
2. Supposing that we are crossing two double heterozygotic pea plants (AaBb x
AaBb). A=tall; a=Dwarf; B=Normal; b=wrinkled.
3. The four types of seeds represent the four possible phenotypes of the cross:
Tall-normal (Corn), Tall-wrinkled (Rice), Dwarf-normal (Mongo) and Dwarf-
wrinkled (Squash).
Note: The materials (e.g. seeds) may be changed with whatever are
available at home.
4. From the container, select randomly 96 seeds and categorize them into four
phenotype classes as above. The actual number of pellets per phenotype
class will constitute the observed (0) frequency or actual observation.
5. The expected (E) results are not exactly equal to the actual observation. This
raises the problem of how much deviation from the expected can be
accepted due purely to chance. Thus, a mathematical tool such as Chi-
square(X) is needed to determine the "goodness of fit".
6. Determining the expected or predictive ratio. The expected number of
individual that are homozygous recessive for both characters will be
determined by dividing the total number of observed individuals by 16.
7. The expected number of individuals exhibiting dominance for both characters
is therefore 9x of homozygous recessive.
8. Expected number of the remaining phenotype classes with at least one
dominant allele will be 3x that of the homozygous recessive.
9. Calculate the deviation (d) between the observed and expected ratios, d/E
and finally X*.
10. The degree of freedom equals the number of classes (phenotypes) minus 1.
Determine a relative standard to serve as the basis for accepting or rejecting
the hypothesis.
11. The relative standard commonly used in biological research is p> 0.05. The p
value is the probability that the deviation of the observed from that expected
is due to chance alone.
12. In this case, using p > 0.05, you would expect any deviation to be due to
chance alone 5% of the time or less. Refer to a chi-square distribution table
(Chi-Square Table). Using the appropriate degrees of 'freedom, locate the
value closest to your calculated chi-square in the table.
13. Determine the closest p (probability) value associated with your chi-square
and degrees of freedom.
Expert Solution
This question has been solved!
Explore an expertly crafted, step-by-step solution for a thorough understanding of key concepts.

This is a popular solution!

Trending now
This is a popular solution!

Step by step
Solved in 2 steps

Recommended textbooks for you
A First Course in Probability (10th Edition)
Probability
ISBN:
9780134753119
Author:
Sheldon Ross
Publisher:
PEARSON

A First Course in Probability (10th Edition)
Probability
ISBN:
9780134753119
Author:
Sheldon Ross
Publisher:
PEARSON