15. Use the From question #13. Between what two years did attendance For both grades drop? double glap (a) If your ansver is 2007 & 2008 color the eyebrows, eyelids, nose and chin brown.
15. Use the From question #13. Between what two years did attendance For both grades drop? double glap (a) If your ansver is 2007 & 2008 color the eyebrows, eyelids, nose and chin brown.

Linear Algebra: A Modern Introduction
4th Edition
ISBN:9781285463247
Author:David Poole
Publisher:David Poole
Chapter2: Systems Of Linear Equations
Section2.4: Applications
Problem 26EQ

Related questions

Concept explainers
Contingency Table
A contingency table can be defined as the visual representation of the relationship between two or more categorical variables that can be evaluated and registered. It is a categorical version of the scatterplot, which is used to investigate the linear relationship between two variables. A contingency table is indeed a type of frequency distribution table that displays two variables at the same time.
Binomial Distribution
Binomial is an algebraic expression of the sum or the difference of two terms. Before knowing about binomial distribution, we must know about the binomial theorem.
Topic Video
Question
Number 15 only
Transcribed Image Text:E Microsoft F X
Microsoft F x
N 7C Social St X
C Clever | Por x
O Mail
A (1) GeneralX
A General (He x
Is-my.sharepoint.com/personal/vaughanc_rcschools_net/_layouts/15/Doc.aspx?sourcedoc3(c0a1c667-ede9-4104-9ece-4e6bd9661aa8)&acti
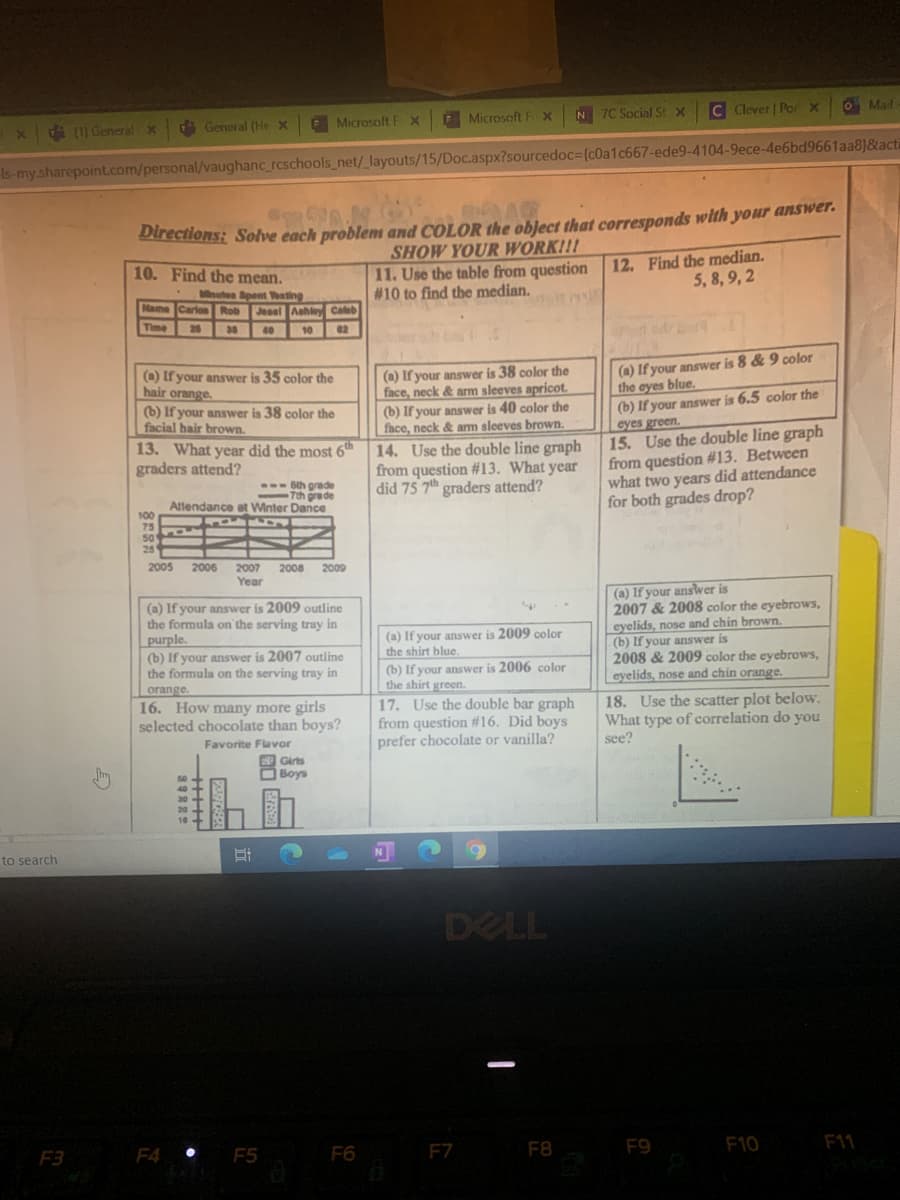
Directions: Solve each problem and COLOR the oblect that corresponds with your answer.
SHOW YOUR WORK!!!
11. Use the table from question 12. Find thc median.
# 10 to find the median.
10. Find the mean.
5, 8, 9, 2
Minuten Spent hating
Name Carloe Rob Jesel Aehley Caleb
Time
26
40
10
02
(a) If your answer is 8 & 9 color
the eyes blue.
(b) If your answer is 6.5 color the
eyes green.
15. Use the double line graph
from question #13. Between
what two years did attendance
for both grades drop?
(0) If your answer is 35 color the
hair orange.
(a) If your answer is 38 color the
face, neck & arm sleeves apricot.
(b) If your answer is 40 color the
face, neck & arm sleeves brown.
(b) If your answer is 38 color the
facial hair brown.
13. What year did the most 6
graders attend?
14. Use the double line graph
from question #13. What year
did 75 7th graders attend?
-- Bth grade
Tth gra de
Attendance at Winter Dance
00
75
50
25
2005
2006
2007
2008
2009
Year
(a) If your answer is 2009 outline
the formula on' the serving tray in
purple.
(b) If your answer is 2007 outline
the formula on the serving tray in
(a) If your answer is
2007 & 2008 color the eyebrows,
eyelids, nose and chin brown.
(b) If your answer is
2008 & 2009 color the eyebrows,
eyelids, nose and chin orange.
(a) If your answer is 2009 color
the shirt blue.
(b) If your answer is 2006 color
the shirt green.
orange.
16. How many more girls
selected chocolate than boys?
17. Use the double bar graph
from question #16. Did boys
prefer chocolate or vanilla?
18. Use the scatter plot below.
What type of correlation do you
see?
Favorite Flavor
Girts
Boys
to search
DELL
F3
F4 •
F5
F6
F7
F8
F9
F10
F11
++++
Expert Solution
This question has been solved!
Explore an expertly crafted, step-by-step solution for a thorough understanding of key concepts.

Step by step
Solved in 2 steps with 1 images

Knowledge Booster


Learn more about
Need a deep-dive on the concept behind this application? Look no further. Learn more about this topic, probability and related others by exploring similar questions and additional content below.Recommended textbooks for you
Linear Algebra: A Modern Introduction
Algebra
ISBN:
9781285463247
Author:
David Poole
Publisher:
Cengage Learning

Algebra for College Students
Algebra
ISBN:
9781285195780
Author:
Jerome E. Kaufmann, Karen L. Schwitters
Publisher:
Cengage Learning

Algebra & Trigonometry with Analytic Geometry
Algebra
ISBN:
9781133382119
Author:
Swokowski
Publisher:
Cengage
Linear Algebra: A Modern Introduction
Algebra
ISBN:
9781285463247
Author:
David Poole
Publisher:
Cengage Learning
Algebra for College Students
Algebra
ISBN:
9781285195780
Author:
Jerome E. Kaufmann, Karen L. Schwitters
Publisher:
Cengage Learning
Algebra & Trigonometry with Analytic Geometry
Algebra
ISBN:
9781133382119
Author:
Swokowski
Publisher:
Cengage

Elementary Linear Algebra (MindTap Course List)
Algebra
ISBN:
9781305658004
Author:
Ron Larson
Publisher:
Cengage Learning