

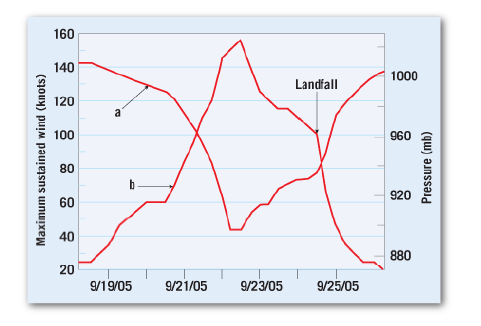
Hurricane Rita was a major storm that struck the Gulf coast in
late September 2005, less than a month after Hurricane Katrina.
The accompanying graph shows changes in air pressure and wind
speed from the storm’s beginning (as an unnamed tropical
disturbance north of the Dominican Republic on September 18)
until its last remnants faded away in Illinois on September 26.
Use the graph to answer these questions.
a. Which line represents air pressure, and which line
represents wind speed? How did you determine your
answer?
b. What was the storm’s maximum wind speed, in knots?
Next, convert your answer to kilometers per hour by
multiplying by 1.85.
c. What was the lowest pressure attained by Hurricane Rita?
d. Using wind speed as your guide, what was the highest
category reached on the Saffir–Simpson scale? On what
day was this status reached?
e. When landfall occurred, what was the category of
Hurricane Rita?

Step by step
Solved in 2 steps
