18. Using the graph below, determine which point is not a viable solution to the system of inequalities. y 2 2x - 5 y > -3r +1 O (0,5) O (3, 4) O (0, 5) O (4, 3)
18. Using the graph below, determine which point is not a viable solution to the system of inequalities. y 2 2x - 5 y > -3r +1 O (0,5) O (3, 4) O (0, 5) O (4, 3)

Elementary Algebra
17th Edition
ISBN:9780998625713
Author:Lynn Marecek, MaryAnne Anthony-Smith
Publisher:Lynn Marecek, MaryAnne Anthony-Smith
Chapter4: Graphs
Section4.7: Graphs Of Linear Inequalities
Problem 4.150TI: Graph the linear inequality y1 .

Related questions
Question
Transcribed Image Text:All changes save
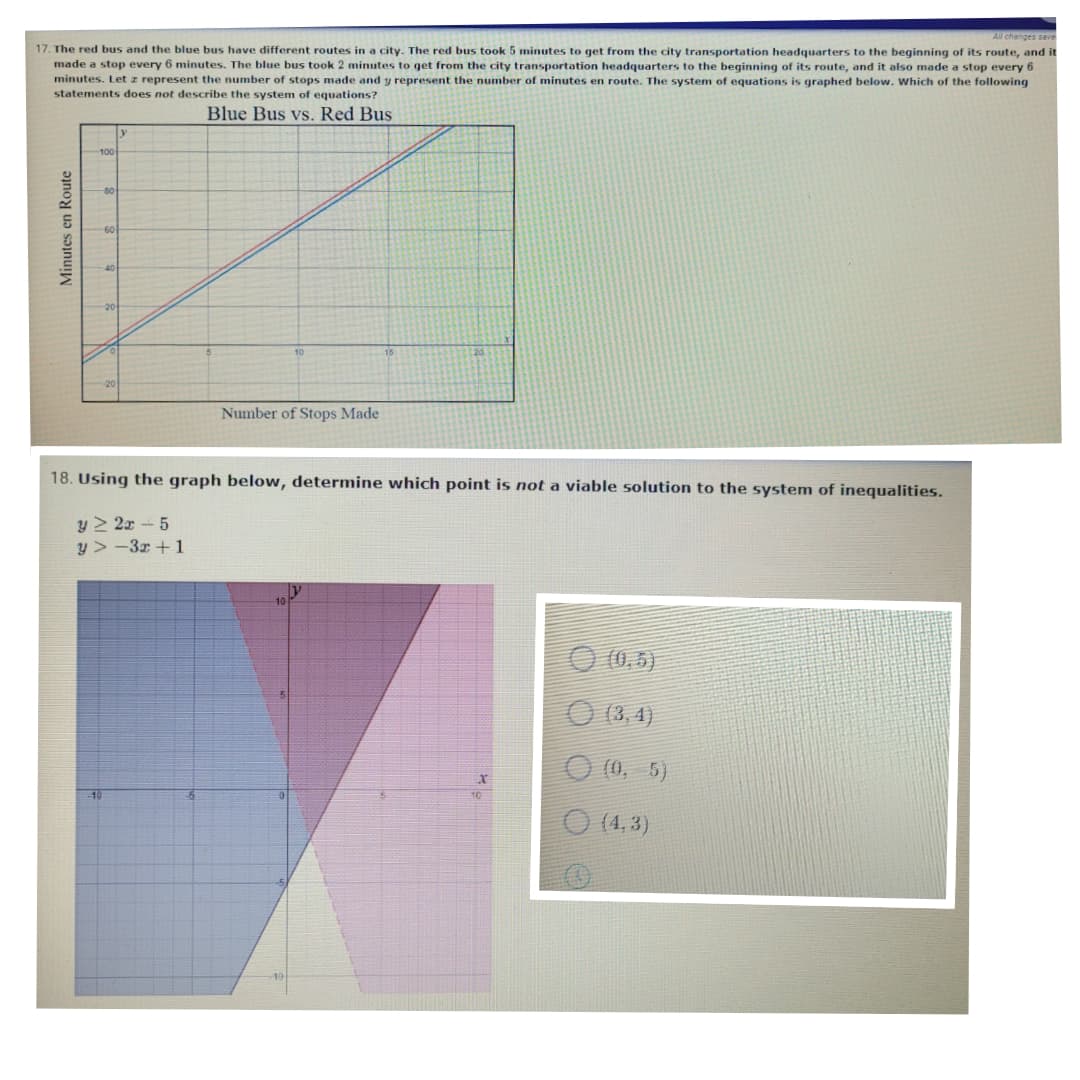
17. The red bus and the blue bus have different routes in a city. The red bus took 5 minutes to get from the city transportation headquarters to the beginning of its route, and it
made a stop every 6 minutes. The blue bus took 2 minutes to qet from the city transportation headquarters to the beginning of its route, and it also made a stop every 6
minutes. Letz represent the number of stops made and y represent the number
statements does not describe the system of equations?
minutes en route. The system of equations is graphed below. Which of the following
Blue Bus vs. Red Bus
-80
Number of Stops Made
18. Using the graph below, determine which point is not a viable solution to the system of inequalities.
y > 2x - 5
y > -3r +1
O (0,5)
O (3, 4)
(0, 5)
(4, 3)
Minutes en Route
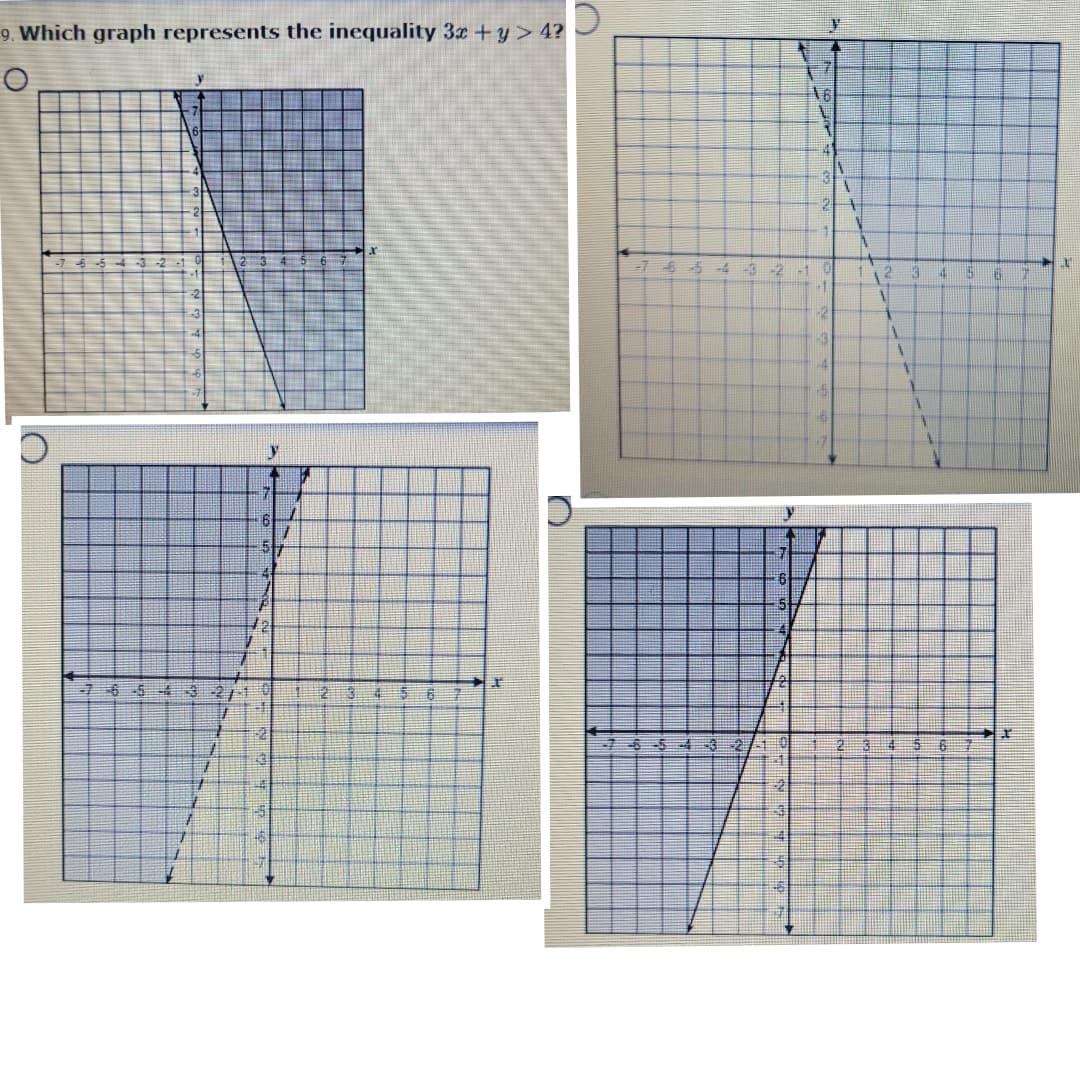
Transcribed Image Text:9. Which graph represents the inequality 3º +y > 4? -
A6
764
-3
-2
-1
3
-2
43
14
7.
517
-5
23
543 2 0
-5
Expert Solution
This question has been solved!
Explore an expertly crafted, step-by-step solution for a thorough understanding of key concepts.

This is a popular solution!

Trending now
This is a popular solution!

Step by step
Solved in 2 steps with 1 images

Recommended textbooks for you
Elementary Algebra
Algebra
ISBN:
9780998625713
Author:
Lynn Marecek, MaryAnne Anthony-Smith
Publisher:
OpenStax - Rice University


Big Ideas Math A Bridge To Success Algebra 1: Stu…
Algebra
ISBN:
9781680331141
Author:
HOUGHTON MIFFLIN HARCOURT
Publisher:
Houghton Mifflin Harcourt
Elementary Algebra
Algebra
ISBN:
9780998625713
Author:
Lynn Marecek, MaryAnne Anthony-Smith
Publisher:
OpenStax - Rice University
Big Ideas Math A Bridge To Success Algebra 1: Stu…
Algebra
ISBN:
9781680331141
Author:
HOUGHTON MIFFLIN HARCOURT
Publisher:
Houghton Mifflin Harcourt

Algebra & Trigonometry with Analytic Geometry
Algebra
ISBN:
9781133382119
Author:
Swokowski
Publisher:
Cengage

Holt Mcdougal Larson Pre-algebra: Student Edition…
Algebra
ISBN:
9780547587776
Author:
HOLT MCDOUGAL
Publisher:
HOLT MCDOUGAL

Algebra: Structure And Method, Book 1
Algebra
ISBN:
9780395977224
Author:
Richard G. Brown, Mary P. Dolciani, Robert H. Sorgenfrey, William L. Cole
Publisher:
McDougal Littell