19. Assuming that population growth is approximately exponential, which of the following two sets of data is most likely to represent the population (in millions) of a city over a 5-year period? 2000 2001 3.36 3.14 Set I Set II 3.24 3.14 2002 2003 2004 Year 3.60 3.54 3.85 4.04 4.11 4.74
19. Assuming that population growth is approximately exponential, which of the following two sets of data is most likely to represent the population (in millions) of a city over a 5-year period? 2000 2001 3.36 3.14 Set I Set II 3.24 3.14 2002 2003 2004 Year 3.60 3.54 3.85 4.04 4.11 4.74

Chapter6: Exponential And Logarithmic Functions
Section: Chapter Questions
Problem 33PT: Enter the data from Table 2 into a graphing calculator and graph the ranking scatter plot. Determine...

Related questions
Question
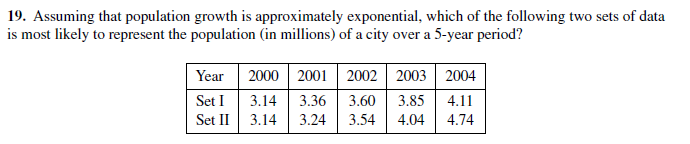
Transcribed Image Text:19. Assuming that population growth is approximately exponential, which of the following two sets of data
is most likely to represent the population (in millions) of a city over a 5-year period?
2000 2001
3.36
3.14
Set I
Set II
3.24
3.14
2002 2003 2004
Year
3.60
3.54
3.85
4.04
4.11
4.74
Expert Solution
This question has been solved!
Explore an expertly crafted, step-by-step solution for a thorough understanding of key concepts.

This is a popular solution!

Trending now
This is a popular solution!

Step by step
Solved in 2 steps with 2 images

Recommended textbooks for you

Trigonometry (MindTap Course List)
Trigonometry
ISBN:
9781337278461
Author:
Ron Larson
Publisher:
Cengage Learning

Trigonometry (MindTap Course List)
Trigonometry
ISBN:
9781337278461
Author:
Ron Larson
Publisher:
Cengage Learning

Algebra & Trigonometry with Analytic Geometry
Algebra
ISBN:
9781133382119
Author:
Swokowski
Publisher:
Cengage