

Q: Match the graph with the function. y y 4 -6 -4 -2 -6 -4 -2 4 6 (1) (II) y y 4 4 2 2 -6 -4 -2 4 6 -6…
A: Given a) y=|x+1|
Q: C. Sketch the graph. 1. y = -x+3 2. y =x- 2 6-54-3-2-1 432-
A:
Q: 1. Which is the graph of (x + 1)2 + (y – 1)2 = 4? -2 y -3 -1 2 -2+
A: (x+1)2 +(y-1)2 = 4 standard form of equation is (x-h)2 +(y-k)2 = r2 so radius = 2 centre = (h,k) =…
Q: Sketch the graph of the equation. y = 16 - x2 %3D 20 19 18 17 16 dele 15 14 13 Fill 12 11 10 No 4…
A: The x and y intercepts of the function are the point where the graph of the function meets the x and…
Q: Hi I am in need of assistance as to how to solve this practice problem.
A: Given equation is: The given equation is ellipse. Comparing with the standard from of ellipse:
Q: True or False To graph y=(x-2)3 shift the graph of y=x3 to the left 2 units.
A: Transformation in a function: To shift a function left: f (x + c) represents that f (x) is shifted c…
Q: 1 Graph: y x < - 1 5+ -5 -4 -3 -2 -1 2 3 4 -3- -4 -5 2.
A: We have to sketch graph y - x/2 ≤ -1
Q: 1 Graph: y =-x-3 2
A: The equation represents a straight line. A line is defined by sequence of points. Lets try to…
Q: 21. Graph 2y +x4x-6 YA YA
A: Given : (1) 2y+x≤ 10 (2) y>4x-6
Q: 4. Graph the function: y 3x-5 LINE 6 4. 3 1. -7 -6 -5 -4 -3 -2 -1 0 -1 1. 2. 3 4. 17 8 9 10 11 12…
A:
Q: -3 -2 -1 0. 1. 2 3. graph for y 4-3(x + 2). y 12 10
A: In this we have to solve for y and make a graph of straight line. So I'm providing hand written…
Q: 13) The graph of y = (x + 3)² + 1 is the graph of y = x? shifted...
A:
Q: Which of the following represents the graph of (x + 2)² = 4y - 6)? O -83 4 ry 14 11 10 9 8 " 5 4 3 2…
A: The given function is x+22=-4y-6
Q: Ay 20어 Graph. y-5=x3 16- ..... Use the graphing tool to graph the equation. 42 Click to enlarge…
A: The given function is y-5=x3
Q: Sketch a graph of x = t + 2t, y = t + 5, t > – 1 . - 5+ 3 2 -5 -4 -3 -2 -1 -1 2 3 4 5 -2 -3 -4 -5-
A:
Q: 1 Sketch the graph of y x – 3 4 51 -5 -4 -3 -2 -1 2 3 -1 -2 -3 -4
A:
Q: Show a rough sketch of the graph of x^2 + y^2 = z^4
A: Given,
Q: 6th(v) 5 4 3 2 1 -6 -5 -4 -3 -2 -1 -1 -2 3 V 1 2 3 4 5 6 Find an equation for the graph above.
A: Sol:- It looks like graph of cosec(x) with some transformation Graph of cosec(x)
Q: 4. The graph of y = −2√x + 4 is translated 3 units to the left. State the defining equation of the…
A:
Q: (a) Sketch the graph of y = x2 - 9. y y 10 10 - 10 -5 5 10 -10 -5 5 10 -5 – 10 -10 y 10 10 -10 -5 10…
A: Explanation of the answer is as follows
Q: S y – x + 2 51 - 4- 3 2 -5 -4 -3 -2 -1 2 3. 4 5 -2 -3 -4- -5+ Clear All Draw: Submit Question
A: The given data is: y<4x-1y>-x+2 To draw the graph of the given inequality.
Q: Graph y = x2 - 8x + 22 and y = -x2 + 8x - 22 on the same set of axes. What relationship seems to…
A: To Graph: y=x2-8x+22y=-x2+8x-22 Concept: Function Notation Type of Transformation Change to…
Q: b) 16 4 y= -0.0519x +1.0777x - 7.4569x + 20.247x- 12.333 12 R = 0.6113 10 10 2. time Calculate point…
A: Given equation y = -0.0519x4 + 1.0777x3 - 7.4569x2 + 20.247x - 12.333
Q: construct the graph y = x² + e ^ x.Find its lowest point
A: A function is usually represented as f(x) where x is the input to the function and f(x) represents…
Q: 1. To draw graph of 4x + 5y 10 find y when x= -3 - 22 22 (C) -3 5.
A: As per bartleby guidelines for more than one question asked only first is to be answered please…
Q: 2 Sketch the graph of y - 1 3
A: Given, The equation of the line is y=-23x-1 .
Q: 8. Sketch the graph of y² = x.
A: y2 = x
Q: y > 2x + 2 Graph: y < - 4x - 1 5+ -5 -4 -3-2-1 | 2 3 4 5 3. 2.
A: Given that: y>2x+2 ............(1)y<-4x-1 ...........(2)
Q: 글 -1 y> Graph: y<- 4x-2
A: Given y>12x-1 andy<-4x-2 Graph the given inequalities
Q: 4y Ay 2. 4. 2. 2.
A:
Q: The graph of y = 2x1/3 + x4/3 changes its concavity at: 1) nowhere 2) both (0,0) and (1,3) 3) (0,0)…
A:
Q: y > T - 2 Graph: |y< - z+1 1 5+
A: Given
Q: Graph y= x by stretching the basic graph y = x. 3
A: The basic graph y= x^2 is an upward-facing parabola.
Q: Create a single graph that has all of the following key features. 1. End behavior: as I -00, f (x) →…
A:
Q: 9x +9y < 81 7x + 15y < 105 Graph: y 2 0
A: The equation of a straight line is represented by the linear equation, ax+by=c. The equation of a…
Q: y – x +1 -
A: To graph the inequalities , first we replace inequality sign by = sign y≤12x2+2y=12x2+2 quadratic…
Q: Sketch the graph of the equation by point plotting. y = Vx + 6 -6 -5 -2 3 10 y y 4 3 2 1 - 10 -5 10…
A:
Q: y - - 2 Graph: 5+ 3- -5 -4 -3 -2 -1 2 3 4 5 -1 -2 -3 -4 -5+ Clear All Draw:
A: See the details solution in below
Q: c. Sketch a graph that has first and second derivatives as indicated. -5- 4 -3- -2- -6 -5 -4 -3 -2…
A:
Q: Graph y = x2 + 10x + 29 and y = -x2 + 10x - 29 on the same set of axes. What relationship seems to…
A: We have the given functions as y=x2+10x+29 ⋯⋯1y=-x2+10x-29 ⋯⋯2 On taking the ordered pair…
Q: 9.3 Graphing WS Graph each 1.) y = -x + 1 -y- -3 -2 -5-4-3 -2 -1 2 3 4 $ -2 3 -4 5
A:
Q: (e) y = 2" +1 (f) y = 2" – 1 (g) y = 2+1 (h) y = 2"-1 -
A: To write the comparison of the graphs given with the graph of y=2x
Q: Graph Tollowilig 6x + 3y = 450 x+ 3y = 150 for x=0 to x= 75 for x=0 to x= 150 Choose the correct…
A:
Q: b) 16 4 y=-0.0519x + 1.0777x -7.4569x+ 20.247x- 12.333 12 R = 0.6113 10 10 tame Calculate point t=10…
A: Underfitting is a scenario in data science where a data model is unable to capture the relationship…
Q: Describe the end behavior of the graph shown. y 10 6. 8. 7. 6. 5. 3 -10 -9 -8 -7 -6 -5 -4 -3 -2 -1…
A: To obtain the end behavior from the graph given
Q: Sy 2а — 1 - 5+ 4 -5 -4 -3 -2 -1 2 3 4 5 -2 -3 -4
A:
Q: Gien fl) = 2 - x, Draw the graph -3 2-4 f9: ー7 -)-, ()3 っ. *2-1 d. flo) =2-C0)) 1* 0月t e fli) -…
A:
Q: F) Graph: 6x – 3y + 12 = 0 구 4 2. -8 -7 -6 -$ -4 -3 -2 -1 2 3 4 6. 7 8 -1 -2 -3 -4 -5 -7
A:
![1. [-/1 Points]
DETAILS
SPRECALC7GE 2.2.009. 0/3 Submissions Used
MY NOTES
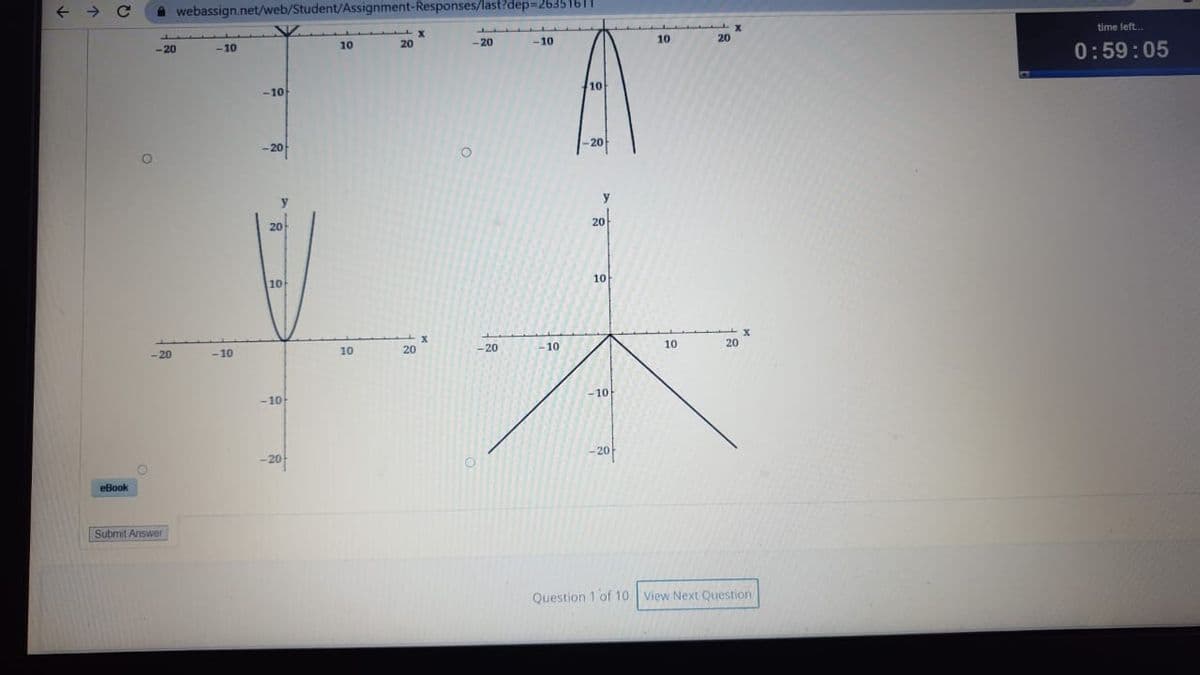
Sketch the graph of the function by first making a table of values. (If an answer is undefined, enter UNDEFINED.)
f(x) = -x2
f(x) = -x?
+4
+3
+2
11
Sketch the graph.
y
y
20
20
10
10
-20
- 10
10
20
-20
10
10
20
- 10
10
-20
-20](/v2/_next/image?url=https%3A%2F%2Fcontent.bartleby.com%2Fqna-images%2Fquestion%2Fa8b25371-1dd7-46a2-a902-55df7a9d4f8f%2F737a121e-7402-41b1-9b5d-cd546a892677%2Fg4859qf_processed.jpeg&w=3840&q=75)


Trending now
This is a popular solution!

Step by step
Solved in 2 steps with 1 images


- A research center claims that more than 29% of employees in a certain country have changed jobs in the past three years. In a random sample of 220 people from that country, 77 have changed jobs in the past three years. At alphaαequals=0.10, is there enough evidence to support the center's claim? Complete parts (a) through (e) below. (a) Identify the claim and state Upper H 0H0 and Upper H Subscript aHa. Identify the claim in this scenario. Select the correct choice below and fill in the answer box to complete your choice. (Type an integer or a decimal. Do not round.) A. At most nothing% of employees in the country have changed jobs in the past three years. B. More than nothing% of employees in the country have changed jobs in the past three years. C. The percentage of employees in the country who have changed jobs in the past three years is not nothing%. D. nothing% of employees in the country have changed jobs in the past three years.…A research center claims that more than 29% of employees in a certain country have changed jobs in the past three years. In a random sample of 220 people from that country, 77 have changed jobs in the past three years. At alphaαequals=0.10, is there enough evidence to support the center's claim? Complete parts (a) through (e) below. (a) Identify the claim and state Upper H 0H0 and Upper H Subscript aHa. Identify the claim in this scenario. Select the correct choice below and fill in the answer box to complete your choice. (Type an integer or a decimal. Do not round.) A. At most nothing% of employees in the country have changed jobs in the past three years. B. More than nothing% of employees in the country have changed jobs in the past three years. C. The percentage of employees in the country who have changed jobs in the past three years is not nothing%. D. nothing% of employees in the country have changed jobs in the past three years.…Consider the following variables: Y=daily productivity score (measured in points) X1=0 if undergraduate student,1 if graduate student X2=hours of sleep per night 1. If you want to test whether type of student modifies the association between hours of sleep per night and daily productivity score, which model (from attached image) should you consider and what is the null hypothesis for this test? A. Use Model 3 and test H0: β2=0 B. Use Model 5 and test H0: β3=0 C. Use Model 5 and test H0: β1=0 D. Use Model 5 and test H0: β2=0 E. Use Model 2 and test H0: β1=0 2. Suppose that you decide to use Model 5 (from pocture attached) to describe the relationship between type of student, hours of sleep per night, and daily productivity score. You use the method of least squares to obtain the following: Y= -0.5 + 3(X1) + 1.5(X2) + 2.5(X1X2) What is the estimated slope relating hours of sleep per night and daily productivity score among undergraduate students? A. 2 B. None of…
- A research center claims that more than 25 % of employees in a certain country have changed jobs in the past four years. In a random sample of 260 people from that country, 78 have changed jobs in the past four years. At alpha equals0.05 , is there enough evidence to support the center's claim? Complete parts (a) through (e) below. (a) Identify the claim and state Upper H 0 and Upper H Subscript a . Identify the claim in this scenario. Select the correct choice below and fill in the answer box to complete your choice. (Type an integer or a decimal. Do not round.) A. At most nothing % of employees in the country have changed jobs in the past four years. B. More than nothing % of employees in the country have changed jobs in the past four years. C. nothing % of employees in the country have changed jobs in the past four years. D. The percentage of employees in the country who have changed jobs…If a researcher wants to find out the average monthly expenses of all university students in Edmonton, this average would be an example of ________ . a. samplecross out b. statisticcross out c. populationcross out d. parameterThe 2019-2020 flu season was especially tough. By the end of the season, an estimated total of 49 million people in the United States had contracted the flu, of whom an estimated 79,000 died from the flu. Assume that the US population was 300,000,000 during the 2019-2020 flu season and that during the season, a total of 2.9 million Americans died from all causes (including the flu). Assume the population of the US remained the same at the midpoint of the season. Report mortality rates per 100,000. Be sure to express the measure in the correct format. a.What was the proportionate mortality rate from flu during the 2019-2020 flu season? b.What was the case fatality rate from flue during the 2019-2020 flu season?
- The 2019-2020 flu season was especially tough.By the end of the season, an estimated total of 49 million people in the United States had contracted the flu, of whom an estimated 79,000 died from the flu. Assume that the US population was 300,000,000 during the 2019-2020 flu season and that during the season, a total of 2.9 million Americans died from all causes (including the flu). Assume the population of the US remained the same at the midpoint of the season. Report mortality rates per 100,000. Be sure to express the measure in the correct format. c.What was the flu-related mortality rate during the 2019-2020 flu season? d.What is the all-cause mortality rate during the 2019-2020 flu season? e.In a country with an age distribution that is much younger than in the US, the proportionate mortality rate from flu in 2019 was 5%. Based on this information alone, can we determine that the risk of dying from flu in 2019 was higher in this country compared to the US? Why or why not?The goal of a ________ is to explain the relationship between observed phenomena, without necessarily being directly testable. datum theory hypothesis quantitative studyWhich of the following is a reason why fixed effect models can't estimate coefficients on variables that do not vary within unit? A, The errors will be homoscedastic. B, The de-meaned variables will not vary. C, We can estimate such a variable with fixed effects. D, Because no fixed effects exists in such a case.
- The scatterplot of these two variables reveals a potential outlying month when the average temperature is about 53◦F and average crawling age is about 28.5 weeks. (a) Does this point have high leverage? (b) Is it an influential point?A panel of dentists is interested in testing two different toothpaste brands (A and B) to see if there is a relationship between the brand and whether or not the patient has a cavity at their next appointment. A representative sample of 60 patients is recruited to take part in the study. At their first appointment of the year, each subject is assigned to brush their teeth with one of the two brands for the next six months. At their follow-up appointment six months later, they were checked for cavities. What method of data collection was used? Select one: a.Experiment b.Observational StudyA panel of dentists is interested in testing two different toothpaste brands (A and B) to see if there is a relationship between the brand and whether or not the patient has a cavity at their next appointment. A representative sample of 60 patients is recruited to take part in the study. At their first appointment of the year, each subject is assigned to brush their teeth with one of the two brands for the next six months. At their follow-up appointment six months later, they were checked for cavities. To test for significance of their findings, which of the following should the dentists use? Select one: a.Paired t-test b.One-sample t-test for a mean c.Linear Regression d.One-sample Z-test for a proportion e.Chi-Square test for independence f.Two-Sample t-test g.One-sample Z-test for a mean