2 of 5 Graph Pleasantvlew Deer 2000 1800 1600 1400 목 1200 1000 800 600 400 200 01234S6789 10 11 12 13 14 Years from Now Based on the graph, the deer population appears to be over time Therefore, this is an) ancton decreasing increasing 1 3. Next Winde date Deer Population
2 of 5 Graph Pleasantvlew Deer 2000 1800 1600 1400 목 1200 1000 800 600 400 200 01234S6789 10 11 12 13 14 Years from Now Based on the graph, the deer population appears to be over time Therefore, this is an) ancton decreasing increasing 1 3. Next Winde date Deer Population

Linear Algebra: A Modern Introduction
4th Edition
ISBN:9781285463247
Author:David Poole
Publisher:David Poole
Chapter4: Eigenvalues And Eigenvectors
Section4.6: Applications And The Perron-frobenius Theorem
Problem 25EQ

Related questions

Question
100%
Transcribed Image Text:dschoology.com/common-assessment-delivery/start/4746117613?action=onresume&isubmissionlds455777172
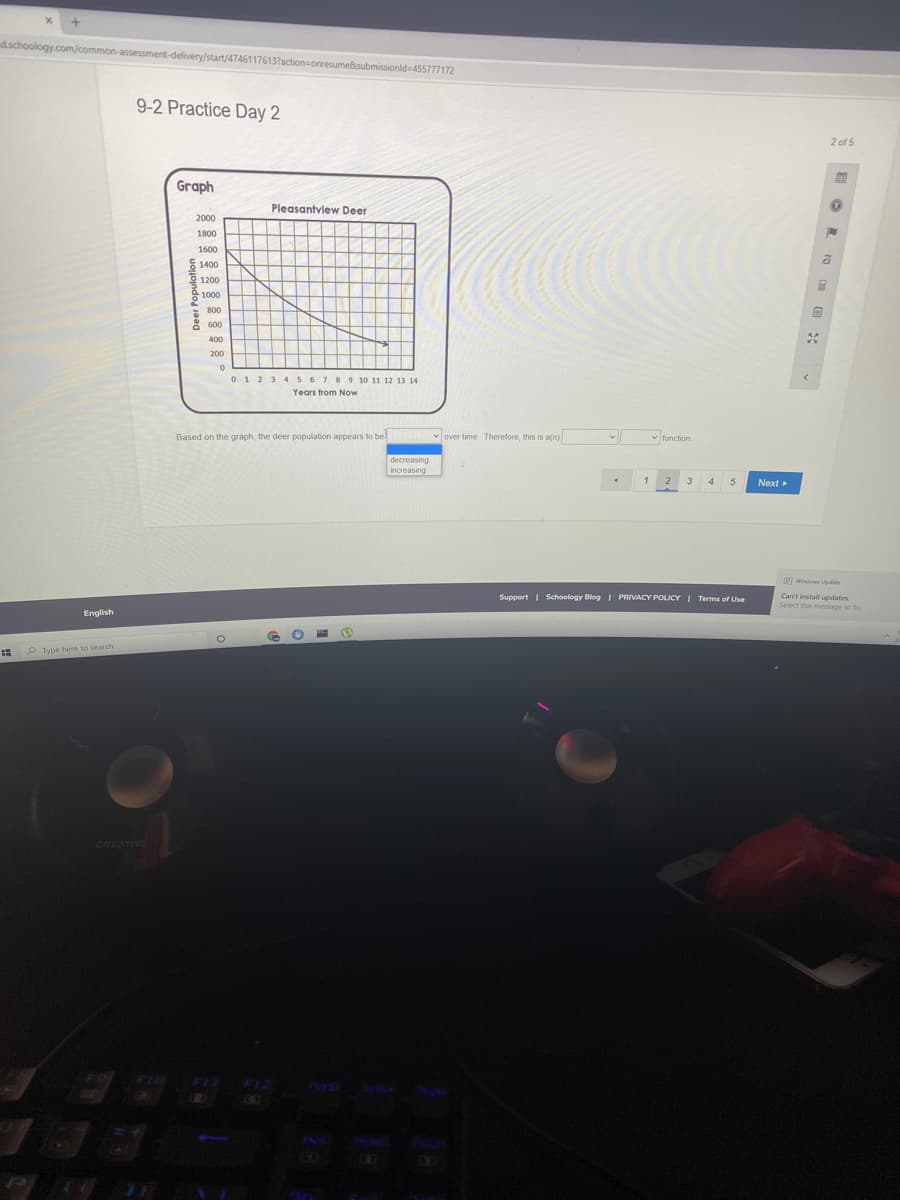
9-2 Practice Day 2
2 of 5
Graph
Pleasantview Deer
2000
1800
1600
E 1400
1200
1000
800
8 600
400
200
012 345 6 789 10 11 12 13 14
Years from Now
Based on the graph, the deer population appears to be
v over time. Therefore, this is a(n)
- function
decreasing
increasing
1
2
3
Next
Windown Lpdate
Support I Schoology Blog I PRIVACY POLICYI Terms of Use
Can't install updates
Select this message to fox
English
O Type here to searchh
CREATIVE
FIL
07
INS
Deer Population
Transcribed Image Text:ology.com/common-assessment-delivery/start/47461
onresume&submissionld=455777172
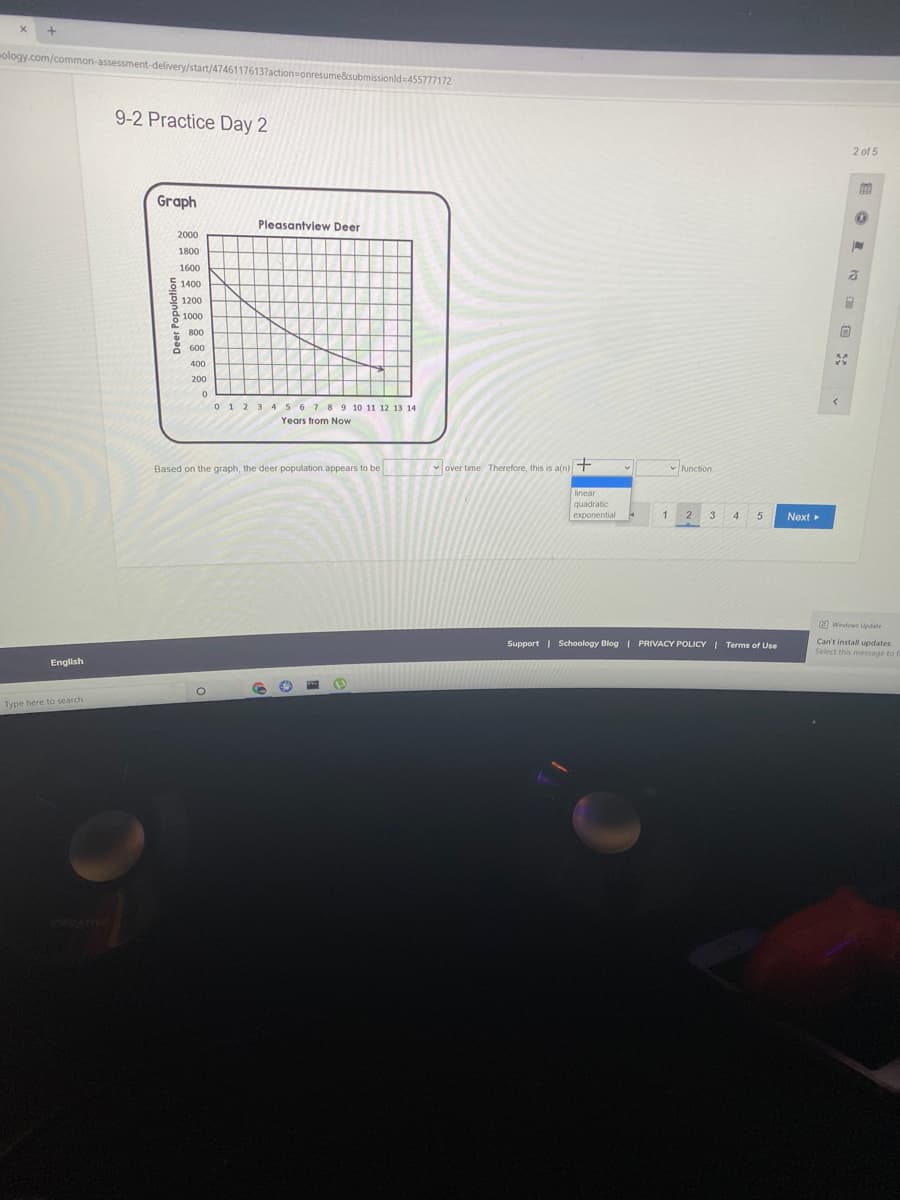
9-2 Practice Day 2
2 of 5
Graph
Pleasantview Deer
2000
1800
1600
5 1400
O 1200
1000
800
8 600
400
200
0 1 2 3 4 567 8 9 10 11 12 13 14
Years from Now
Based on the graph, the deer population appears to be
over time Therefore, this is a(n)+
function.
quadratic
exponential
1
2
Next
E Windows Update
Support | Schoology Blog | PRIVACY POLICY I Terms of Use
Can't install updates.
Select this message to
English
Type here to search
Expert Solution
This question has been solved!
Explore an expertly crafted, step-by-step solution for a thorough understanding of key concepts.

Step by step
Solved in 2 steps with 2 images

Knowledge Booster


Learn more about
Need a deep-dive on the concept behind this application? Look no further. Learn more about this topic, algebra and related others by exploring similar questions and additional content below.Recommended textbooks for you
Linear Algebra: A Modern Introduction
Algebra
ISBN:
9781285463247
Author:
David Poole
Publisher:
Cengage Learning

Algebra & Trigonometry with Analytic Geometry
Algebra
ISBN:
9781133382119
Author:
Swokowski
Publisher:
Cengage
Linear Algebra: A Modern Introduction
Algebra
ISBN:
9781285463247
Author:
David Poole
Publisher:
Cengage Learning
Algebra & Trigonometry with Analytic Geometry
Algebra
ISBN:
9781133382119
Author:
Swokowski
Publisher:
Cengage