2) The table below shows the results of some random high school students about their pets. Own a Dog Do not own a Dog Total Own a Cat 25 16 41 Do not own a Cat 17 26 Total 42 25 67 a) Take the values from the two-way table above and put them in the following Venn Diagram. Be sure to label the circles. Own a dog Qwn a cat 25 17 16 9 b) Suppose that we randomly choose a student. Find the following probabilities. Pr(Own a dog) = 62% Pr(Own a cat) = 61% Pr(not owning a dog) = 37% Pr(not owing a cat) = 38% %3D Pr(own a dog and not a cat) = 25% Pr(own a cat and not a dog) = 23% c) Are the events "do not own a dog" and "do not own a cat" mutually exclusive? Explain.
2) The table below shows the results of some random high school students about their pets. Own a Dog Do not own a Dog Total Own a Cat 25 16 41 Do not own a Cat 17 26 Total 42 25 67 a) Take the values from the two-way table above and put them in the following Venn Diagram. Be sure to label the circles. Own a dog Qwn a cat 25 17 16 9 b) Suppose that we randomly choose a student. Find the following probabilities. Pr(Own a dog) = 62% Pr(Own a cat) = 61% Pr(not owning a dog) = 37% Pr(not owing a cat) = 38% %3D Pr(own a dog and not a cat) = 25% Pr(own a cat and not a dog) = 23% c) Are the events "do not own a dog" and "do not own a cat" mutually exclusive? Explain.

Elementary Geometry For College Students, 7e
7th Edition
ISBN:9781337614085
Author:Alexander, Daniel C.; Koeberlein, Geralyn M.
Publisher:Alexander, Daniel C.; Koeberlein, Geralyn M.
ChapterP: Preliminary Concepts
SectionP.1: Sets And Geometry
Problem 20E: What relationship subset, intersect, disjoint, or equivalent can be used to characterize the two...

Related questions

Topic Video
Question
Can someone explain letter C to me I don't understand what it's asking.
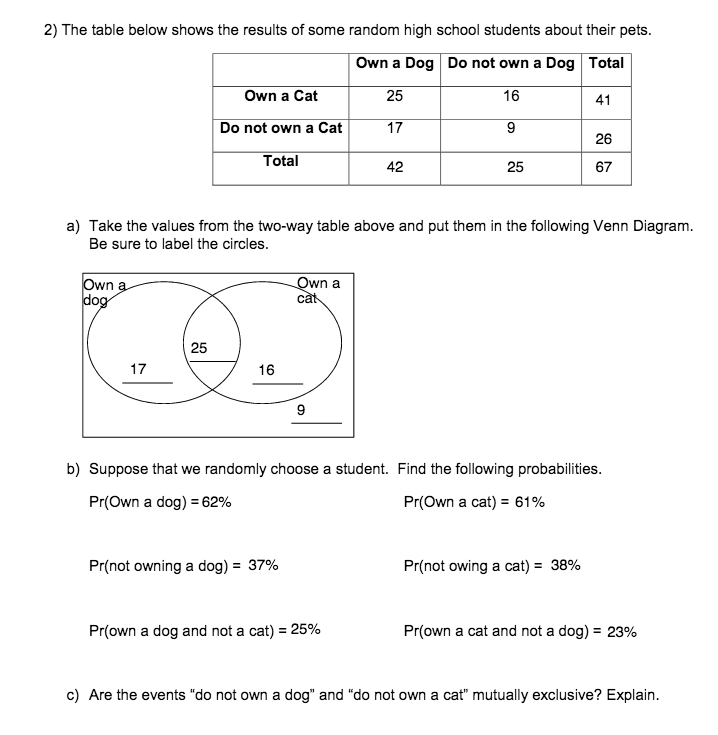
Transcribed Image Text:2) The table below shows the results of some random high school students about their pets.
Own a Dog Do not own a Dog Total
Own a Cat
25
16
41
Do not own a Cat
17
26
Total
42
25
67
a) Take the values from the two-way table above and put them in the following Venn Diagram.
Be sure to label the circles.
Own a
dog
Qwn a
cat
25
17
16
9
b) Suppose that we randomly choose a student. Find the following probabilities.
Pr(Own a dog) = 62%
Pr(Own a cat) = 61%
Pr(not owning a dog) = 37%
Pr(not owing a cat) = 38%
%3D
Pr(own a dog and not a cat) = 25%
Pr(own a cat and not a dog) = 23%
c) Are the events "do not own a dog" and "do not own a cat" mutually exclusive? Explain.
Expert Solution
This question has been solved!
Explore an expertly crafted, step-by-step solution for a thorough understanding of key concepts.

This is a popular solution!

Trending now
This is a popular solution!

Step by step
Solved in 3 steps with 3 images

Knowledge Booster


Learn more about
Need a deep-dive on the concept behind this application? Look no further. Learn more about this topic, probability and related others by exploring similar questions and additional content below.Recommended textbooks for you
Elementary Geometry For College Students, 7e
Geometry
ISBN:
9781337614085
Author:
Alexander, Daniel C.; Koeberlein, Geralyn M.
Publisher:
Cengage,

Holt Mcdougal Larson Pre-algebra: Student Edition…
Algebra
ISBN:
9780547587776
Author:
HOLT MCDOUGAL
Publisher:
HOLT MCDOUGAL

Glencoe Algebra 1, Student Edition, 9780079039897…
Algebra
ISBN:
9780079039897
Author:
Carter
Publisher:
McGraw Hill
Elementary Geometry For College Students, 7e
Geometry
ISBN:
9781337614085
Author:
Alexander, Daniel C.; Koeberlein, Geralyn M.
Publisher:
Cengage,
Holt Mcdougal Larson Pre-algebra: Student Edition…
Algebra
ISBN:
9780547587776
Author:
HOLT MCDOUGAL
Publisher:
HOLT MCDOUGAL
Glencoe Algebra 1, Student Edition, 9780079039897…
Algebra
ISBN:
9780079039897
Author:
Carter
Publisher:
McGraw Hill