2. a. The accompanying figure shows the velocity (m/sec) of a body moving along the s-axis during the time interval from t = 0 to t = 10 sec. About how far did the body travel during those 10 sec? b. Sketch a graph of s as a function of t for 0 < t < 10, assum- ing s(0) = 0. 5 2 4 6 8 10 Time (sec) Velocity (m/sec) 3.
2. a. The accompanying figure shows the velocity (m/sec) of a body moving along the s-axis during the time interval from t = 0 to t = 10 sec. About how far did the body travel during those 10 sec? b. Sketch a graph of s as a function of t for 0 < t < 10, assum- ing s(0) = 0. 5 2 4 6 8 10 Time (sec) Velocity (m/sec) 3.

Chapter6: Exponential And Logarithmic Functions
Section6.1: Exponential Functions
Problem 57SE: Repeat the previous exercise to find the formula forthe APY of an account that compounds daily....

Related questions
Question
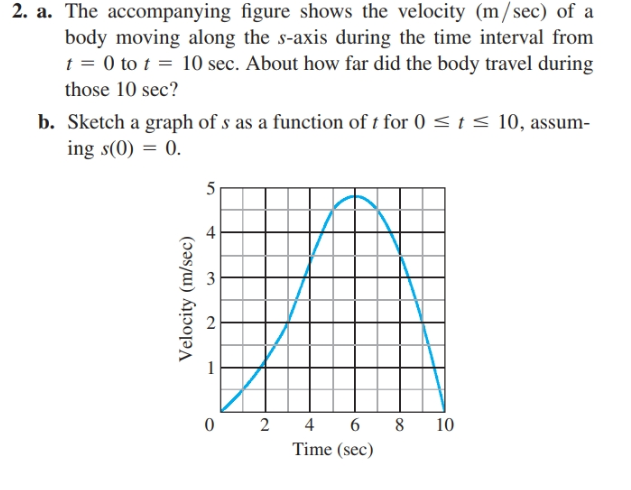
Transcribed Image Text:2. a. The accompanying figure shows the velocity (m/sec) of a
body moving along the s-axis during the time interval from
t = 0 to t = 10 sec. About how far did the body travel during
those 10 sec?
b. Sketch a graph of s as a function of t for 0 < t < 10, assum-
ing s(0) = 0.
5
2 4 6 8
10
Time (sec)
Velocity (m/sec)
3.
Expert Solution
This question has been solved!
Explore an expertly crafted, step-by-step solution for a thorough understanding of key concepts.

This is a popular solution!

Trending now
This is a popular solution!

Step by step
Solved in 6 steps with 6 images

Recommended textbooks for you

Algebra & Trigonometry with Analytic Geometry
Algebra
ISBN:
9781133382119
Author:
Swokowski
Publisher:
Cengage

Functions and Change: A Modeling Approach to Coll…
Algebra
ISBN:
9781337111348
Author:
Bruce Crauder, Benny Evans, Alan Noell
Publisher:
Cengage Learning
Algebra & Trigonometry with Analytic Geometry
Algebra
ISBN:
9781133382119
Author:
Swokowski
Publisher:
Cengage
Functions and Change: A Modeling Approach to Coll…
Algebra
ISBN:
9781337111348
Author:
Bruce Crauder, Benny Evans, Alan Noell
Publisher:
Cengage Learning