2. As the universe has expanded, its temperature has been decreasing with time. The figure below is a plot of the temperature T (in kelvin) as a function of time t (in gigayears, abbreviated as "Gyr") since the Big Bang. It has been derived from the measurements of galaxy redshifts as reported in Ref. [1]. 14 13 12 ● 11 10 9 :. 0 1 2 5 6 7 8 9 10 11 12 13 14 Time since the Big Bang (Gyr) (a) Write down two of the six simple functions from the formula sheet that might provide a good fit to the data in this plot, and explain why each would be suitable. For each function, explain whether the unknown constants should be positive or negative. Temperature (K) 7 5 4 3 2 .. °8
2. As the universe has expanded, its temperature has been decreasing with time. The figure below is a plot of the temperature T (in kelvin) as a function of time t (in gigayears, abbreviated as "Gyr") since the Big Bang. It has been derived from the measurements of galaxy redshifts as reported in Ref. [1]. 14 13 12 ● 11 10 9 :. 0 1 2 5 6 7 8 9 10 11 12 13 14 Time since the Big Bang (Gyr) (a) Write down two of the six simple functions from the formula sheet that might provide a good fit to the data in this plot, and explain why each would be suitable. For each function, explain whether the unknown constants should be positive or negative. Temperature (K) 7 5 4 3 2 .. °8

Big Ideas Math A Bridge To Success Algebra 1: Student Edition 2015
1st Edition
ISBN:9781680331141
Author:HOUGHTON MIFFLIN HARCOURT
Publisher:HOUGHTON MIFFLIN HARCOURT
Chapter8: Graphing Quadratic Functions
Section: Chapter Questions
Problem 30CR

Related questions
Question
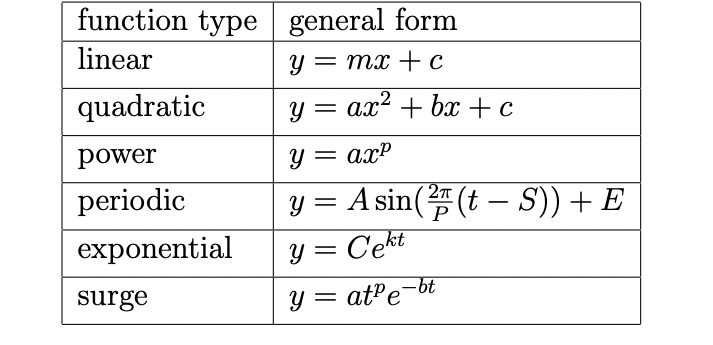
Transcribed Image Text:function type general form
linear
y = mx + c
quadratic
y = ax² +bx+c
power
y = ax²
periodic
y = A sin((t — S)) + E
exponential
y = Cekt
surge
y=ate-bt
![2. As the universe has expanded, its temperature has been decreasing with time. The figure below
is a plot of the temperature T (in kelvin) as a function of time t (in gigayears, abbreviated as
"Gyr") since the Big Bang. It has been derived from the measurements of galaxy redshifts as
reported in Ref. [1].
14
13
12
11
10
4
:-
3
2+
0
1 2 3 4 5 6 7 8 9 10 11 12 13 14
Time since the Big Bang (Gyr)
(a) Write down two of the six simple functions from the formula sheet that might provide a
good fit to the data in this plot, and explain why each would be suitable. For each function,
explain whether the unknown constants should be positive or negative.
Temperature (K)
00](/v2/_next/image?url=https%3A%2F%2Fcontent.bartleby.com%2Fqna-images%2Fquestion%2Fbbcca6c5-ac94-45d2-abbc-b5bb3d17eb80%2F55ee0131-1da6-4679-b05d-729e3481d50a%2Fle5stni_processed.png&w=3840&q=75)
Transcribed Image Text:2. As the universe has expanded, its temperature has been decreasing with time. The figure below
is a plot of the temperature T (in kelvin) as a function of time t (in gigayears, abbreviated as
"Gyr") since the Big Bang. It has been derived from the measurements of galaxy redshifts as
reported in Ref. [1].
14
13
12
11
10
4
:-
3
2+
0
1 2 3 4 5 6 7 8 9 10 11 12 13 14
Time since the Big Bang (Gyr)
(a) Write down two of the six simple functions from the formula sheet that might provide a
good fit to the data in this plot, and explain why each would be suitable. For each function,
explain whether the unknown constants should be positive or negative.
Temperature (K)
00
Expert Solution
This question has been solved!
Explore an expertly crafted, step-by-step solution for a thorough understanding of key concepts.

Step by step
Solved in 3 steps with 3 images

Recommended textbooks for you
Big Ideas Math A Bridge To Success Algebra 1: Stu…
Algebra
ISBN:
9781680331141
Author:
HOUGHTON MIFFLIN HARCOURT
Publisher:
Houghton Mifflin Harcourt

Algebra & Trigonometry with Analytic Geometry
Algebra
ISBN:
9781133382119
Author:
Swokowski
Publisher:
Cengage

Functions and Change: A Modeling Approach to Coll…
Algebra
ISBN:
9781337111348
Author:
Bruce Crauder, Benny Evans, Alan Noell
Publisher:
Cengage Learning
Big Ideas Math A Bridge To Success Algebra 1: Stu…
Algebra
ISBN:
9781680331141
Author:
HOUGHTON MIFFLIN HARCOURT
Publisher:
Houghton Mifflin Harcourt
Algebra & Trigonometry with Analytic Geometry
Algebra
ISBN:
9781133382119
Author:
Swokowski
Publisher:
Cengage
Functions and Change: A Modeling Approach to Coll…
Algebra
ISBN:
9781337111348
Author:
Bruce Crauder, Benny Evans, Alan Noell
Publisher:
Cengage Learning

Algebra and Trigonometry (MindTap Course List)
Algebra
ISBN:
9781305071742
Author:
James Stewart, Lothar Redlin, Saleem Watson
Publisher:
Cengage Learning

Trigonometry (MindTap Course List)
Trigonometry
ISBN:
9781337278461
Author:
Ron Larson
Publisher:
Cengage Learning