2. Consider the following data. 1 2 3 4 5 6 7 2 35 150 500 1250 2500 5000 X y Apply the whole modeling process: 1) Consider a modeling assumption and its linearized version Y = AX + B. You may assume that the model is a power function model or an exponential model. 2) Test the suitability of the model assumptions. 3) Develop a model on this basis by determining the model parameters. 4) Test the suitability of your model by comparing it with the original data. Calculate the relative error in % for each data point. Comment on the suitability of your model. 5) Consider the y value at x=2.5. At which x is this value y(x=2.5) increased by 150% according to the model?
2. Consider the following data. 1 2 3 4 5 6 7 2 35 150 500 1250 2500 5000 X y Apply the whole modeling process: 1) Consider a modeling assumption and its linearized version Y = AX + B. You may assume that the model is a power function model or an exponential model. 2) Test the suitability of the model assumptions. 3) Develop a model on this basis by determining the model parameters. 4) Test the suitability of your model by comparing it with the original data. Calculate the relative error in % for each data point. Comment on the suitability of your model. 5) Consider the y value at x=2.5. At which x is this value y(x=2.5) increased by 150% according to the model?

Functions and Change: A Modeling Approach to College Algebra (MindTap Course List)
6th Edition
ISBN:9781337111348
Author:Bruce Crauder, Benny Evans, Alan Noell
Publisher:Bruce Crauder, Benny Evans, Alan Noell
Chapter5: A Survey Of Other Common Functions
Section5.6: Higher-degree Polynomials And Rational Functions
Problem 1TU: The following fictitious table shows kryptonite price, in dollar per gram, t years after 2006. t=...

Related questions
Question
Transcribed Image Text:2.
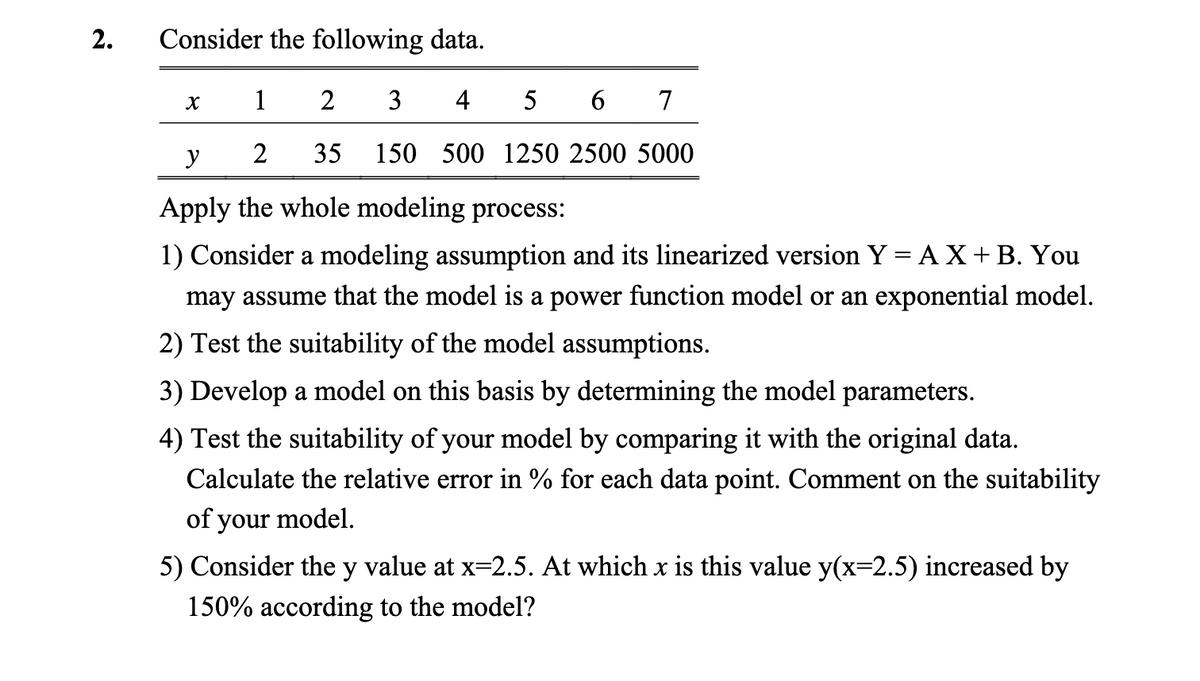
Consider the following data.
1
2
3
4
5
6 7
2 35 150 500 1250 2500 5000
X
y
Apply the whole modeling process:
1) Consider a modeling assumption and its linearized version Y = AX + B. You
may assume that the model is a power function model or an exponential model.
2) Test the suitability of the model assumptions.
3) Develop a model on this basis by determining the model parameters.
4) Test the suitability of your model by comparing it with the original data.
Calculate the relative error in % for each data point. Comment on the suitability
of your model.
5) Consider the y value at x=2.5. At which x is this value y(x=2.5) increased by
150% according to the model?
Expert Solution
This question has been solved!
Explore an expertly crafted, step-by-step solution for a thorough understanding of key concepts.

This is a popular solution!

Trending now
This is a popular solution!

Step by step
Solved in 2 steps with 1 images

Recommended textbooks for you
Functions and Change: A Modeling Approach to Coll…
Algebra
ISBN:
9781337111348
Author:
Bruce Crauder, Benny Evans, Alan Noell
Publisher:
Cengage Learning

Linear Algebra: A Modern Introduction
Algebra
ISBN:
9781285463247
Author:
David Poole
Publisher:
Cengage Learning

Algebra & Trigonometry with Analytic Geometry
Algebra
ISBN:
9781133382119
Author:
Swokowski
Publisher:
Cengage
Functions and Change: A Modeling Approach to Coll…
Algebra
ISBN:
9781337111348
Author:
Bruce Crauder, Benny Evans, Alan Noell
Publisher:
Cengage Learning
Linear Algebra: A Modern Introduction
Algebra
ISBN:
9781285463247
Author:
David Poole
Publisher:
Cengage Learning
Algebra & Trigonometry with Analytic Geometry
Algebra
ISBN:
9781133382119
Author:
Swokowski
Publisher:
Cengage