2. Sketch the f v.s. Uind graph for given data table. Determine the value of po and calculate the error percentage. (Ho theonstica1.26x10* V.s/m.A). (N=485, n=300, R-13mm, l=16cm, lo-25mA) f (Hz) Uind (V) 1.0 0.015 0.026 0.038 0.050 2.0 3.0 4.0 5.0 0.067 0.083 6.0 7.0 0.106 8.0 0.126 9.0 0.155 10.0 0.178
2. Sketch the f v.s. Uind graph for given data table. Determine the value of po and calculate the error percentage. (Ho theonstica1.26x10* V.s/m.A). (N=485, n=300, R-13mm, l=16cm, lo-25mA) f (Hz) Uind (V) 1.0 0.015 0.026 0.038 0.050 2.0 3.0 4.0 5.0 0.067 0.083 6.0 7.0 0.106 8.0 0.126 9.0 0.155 10.0 0.178

Related questions
Question
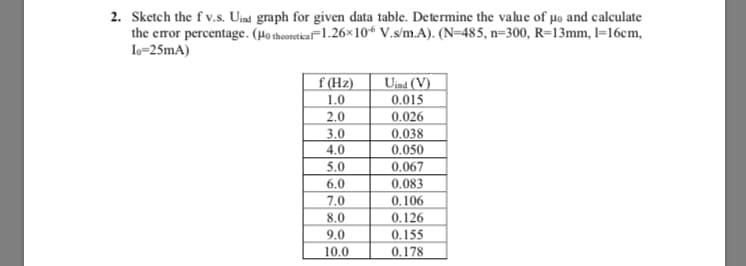
Transcribed Image Text:2. Sketch the f v.s. Uind graph for given data table. Determine the value of po and calculate
the error percentage. (Ho theonstica1.26x10* V.s/m.A). (N=485, n=300, R-13mm, l=16cm,
lo-25mA)
f (Hz)
Uind (V)
1.0
0.015
0.026
0.038
0.050
2.0
3.0
4.0
5.0
0.067
0.083
6.0
7.0
0.106
8.0
0.126
9.0
0.155
10.0
0.178
Expert Solution
This question has been solved!
Explore an expertly crafted, step-by-step solution for a thorough understanding of key concepts.

This is a popular solution!

Trending now
This is a popular solution!

Step by step
Solved in 4 steps with 4 images
