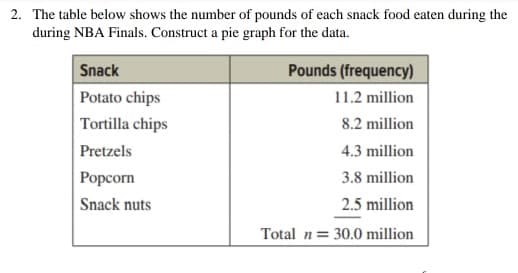
2. The table below shows the number of pounds of each snack food eaten during the during NBA Finals. Construct a pie graph for the data. Snack Pounds (frequency) Potato chips 11.2 million Tortilla chips 8.2 million Pretzels 4.3 million Popcorn 3.8 million Snack nuts 2.5 million Total n= 30.0 million
2. The table below shows the number of pounds of each snack food eaten during the during NBA Finals. Construct a pie graph for the data. Snack Pounds (frequency) Potato chips 11.2 million Tortilla chips 8.2 million Pretzels 4.3 million Popcorn 3.8 million Snack nuts 2.5 million Total n= 30.0 million

Glencoe Algebra 1, Student Edition, 9780079039897, 0079039898, 2018
18th Edition
ISBN:9780079039897
Author:Carter
Publisher:Carter
Chapter10: Statistics
Section10.5: Comparing Sets Of Data
Problem 26PFA

Related questions
Question
Transcribed Image Text:2. The table below shows the number of pounds of each snack food eaten during the
during NBA Finals. Construct a pie graph for the data.
Snack
Pounds (frequency)
Potato chips
Tortilla chips
11.2 million
8.2 million
Pretzels
4.3 million
Popcorn
Snack nuts
3.8 million
2.5 million
Total n= 30.0 million
Expert Solution
This question has been solved!
Explore an expertly crafted, step-by-step solution for a thorough understanding of key concepts.

Step by step
Solved in 2 steps with 2 images

Recommended textbooks for you
Glencoe Algebra 1, Student Edition, 9780079039897…
Algebra
ISBN:
9780079039897
Author:
Carter
Publisher:
McGraw Hill

Holt Mcdougal Larson Pre-algebra: Student Edition…
Algebra
ISBN:
9780547587776
Author:
HOLT MCDOUGAL
Publisher:
HOLT MCDOUGAL
Glencoe Algebra 1, Student Edition, 9780079039897…
Algebra
ISBN:
9780079039897
Author:
Carter
Publisher:
McGraw Hill
Holt Mcdougal Larson Pre-algebra: Student Edition…
Algebra
ISBN:
9780547587776
Author:
HOLT MCDOUGAL
Publisher:
HOLT MCDOUGAL