2. Use the expression, 2M,8 T = X2 sin e which is of the form y = mx + b L sine to find the mass of the meter stick + rider M, (from the y intercept) and the length of the meter stick L (from the slope). Include a derivation of this equation in your "Theory" section. On your "Tabulated Results Page," give both the directly measured values of mass and length of the meter stick + rider as well as those values determined from the graph; indicate a percent difference and an estimated uncertainty for each.
2. Use the expression, 2M,8 T = X2 sin e which is of the form y = mx + b L sine to find the mass of the meter stick + rider M, (from the y intercept) and the length of the meter stick L (from the slope). Include a derivation of this equation in your "Theory" section. On your "Tabulated Results Page," give both the directly measured values of mass and length of the meter stick + rider as well as those values determined from the graph; indicate a percent difference and an estimated uncertainty for each.

Related questions
Question
Please answer quickly. I do not understand why I seem to be getting incorrect answers. The first picture is the question and the second is the data.
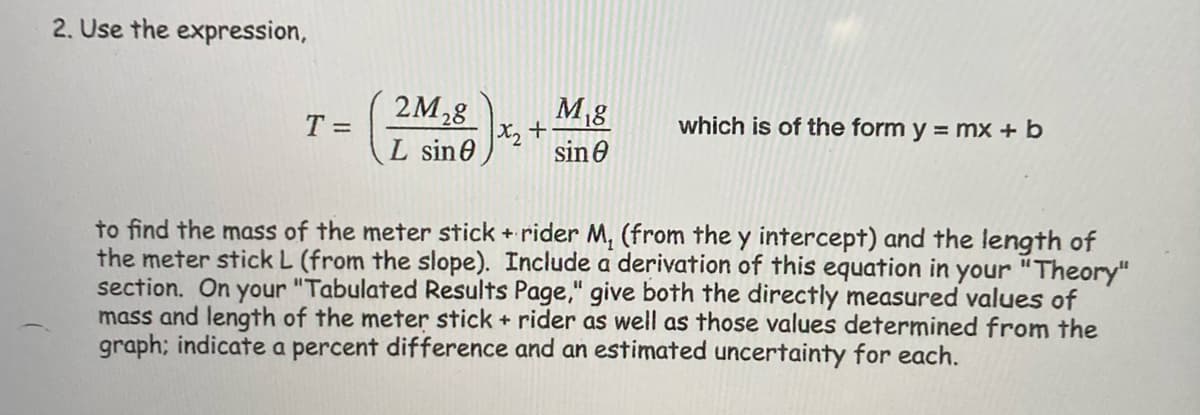
Transcribed Image Text:2. Use the expression,
M8
2M28
X2 +
sin 0
T =
which is of the form y = mx + b
L sin0
to find the mass of the meter stick + rider M, (from the y intercept) and the length of
the meter stick L (from the slope). Include a derivation of this equation in your "Theory"
section. On your "Tabulated Results Page," give both the directly measured values of
mass and length of the meter stick + rider as well as those values determined from the
graph; indicate a percent difference and an estimated uncertainty for each.
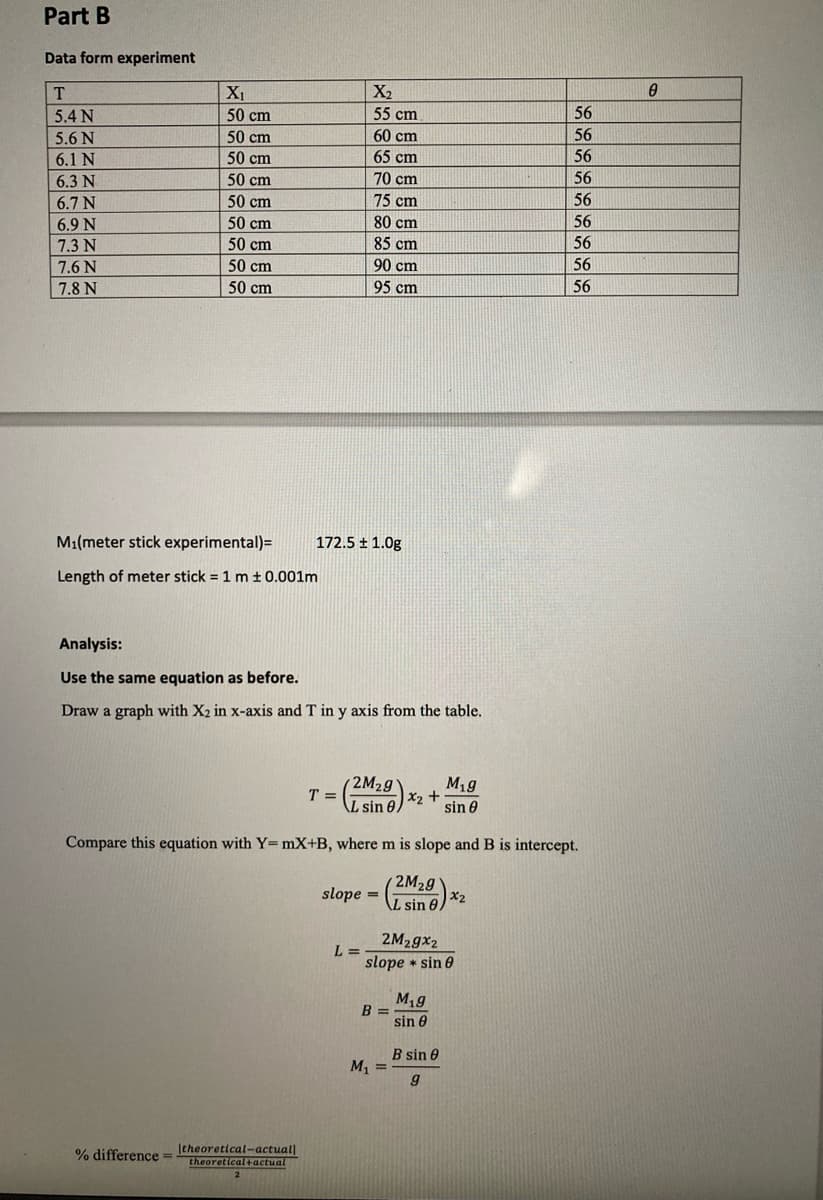
Transcribed Image Text:Part B
Data form experiment
X1
X2
55 cm
56
5.4 N
5.6 N
50 cm
50 cm
60 cm
56
6.1 N
50 cm
65 cm
56
6.3 N
50 cm
70 cm
56
6.7 N
50 cm
75 cm
56
50 cm
80 cm
85 cm
6.9 N
56
7.3 N
50 cm
56
7.6 N
50 cm
90 cm
56
7.8 N
50 cm
95 cm
56
M1(meter stick experimental)=
172.5 + 1.0g
Length of meter stick = 1 m t 0.001m
Analysis:
Use the same equation as before.
Draw a graph with X2 in x-axis and T in y axis from the table.
2M29
M1g
X2 +
sin 0
T =
AL sin 0
Compare this equation with Y= mX+B, where m is slope and B is intercept.
2M29
28x2
L sin 0/
slope =
2M29X2
L =
slope • sin 0
M,9
B =
sin e
B sin 0
M1 =
|theoretical-actual
theoretical+actual
% difference =
2
Expert Solution
This question has been solved!
Explore an expertly crafted, step-by-step solution for a thorough understanding of key concepts.

This is a popular solution!

Trending now
This is a popular solution!

Step by step
Solved in 2 steps with 1 images
