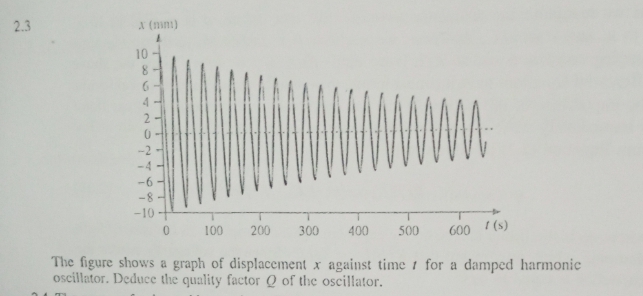
2.3 A (mm) 10 8- 4- 2. -10 100 200 300 400 500 600 (s) The figure shows a graph of displacement x against time for a damped harmonic oscillator. Deduce the quality factor Q of the oscillator.

Q: Point charges 30 nC, -20 nC, -5 nC and 10nC are located at (-1,0,2), (0,0,0), (2,4,0) and (1,5,-1), ...
A: Let q1, q2, q3, and q4 denote the four charges are located at r1, r2, r3, and r4, l denotes the cube...
Q: A 0.60 kg cue ball (A) travelling at 1.5 m/s collides with a 0.50 kg numbered ball (B) which is at r...
A: The mass of the cue ball-A is given as, mC = 0.60 kg The velocity of cue ball-A before collision is ...
Q: Q3:- (a) Find the change in wavelength of 85 pm x-rays that are scattered 115° by a target. (b) Find...
A: The Compton formula is given as: λ-λo = λc(1-Cosθ)where, λ is the wavelength of the scat...
Q: Take two Maxwell equations in free space (no rho, no j) and derive a differential equation for the B...
A: Given Take two Maxwell equations in free space (no rho, no j) and derive a differential equation for...
Q: Listed below are several fictional stars with their luminosities and distances from Earth given. Ran...
A: Given information: The relative luminosity and distance of the stars from the Earth: Q-bert: L=400 L...
Q: S Page view A Read aloud V Draw Highlight Question 1 a Thuncthion of time 1.75kg particle mover as F...
A: The mass of the particle is given as, m = 1.75 kg The equation of motion of particle is given as, x ...
Q: Q3:- (a) Find the change in wavelength of 85 pm x-rays that are scattered 115° by a target. (b) Find...
A:
Q: Q2) Figure 2 shows a rope that is stretched between points A and C, there is mass m at point B. Give...
A: Given
Q: an electron in the n=2, 1=0,m=0 state of hydrogen decays by a sequence of transitions to the ground ...
A: According to question, electron is in ψ2,0,0 state, now it decays by a sequences of transition to th...
Q: If all other forces can be ignored and the strength of the frictional force is greater than the appl...
A: Given: If all other forces can be ignored and the strength of the frictional force is greater than t...
Q: 3-
A:
Q: Q2:- Light from the sun arrives at the earth, an average of 1.48 x 10" m away, at the rate of 1.4 kW...
A: Given data: The distance is d=1.48×10¹¹ m. The intensity is I=1.4 kW/m2. The frequency is ν=4.95×10...
Q: Find the expected value of the position and the momentum of a particle in a one- dimensional box V...
A:
Q: A nuclear isotope has a mean lifetime of 76.7 s. What is the half life of this isotope? Number If in...
A: The mean lifetime of radioactive nuclei is given by, tm = 1λ where, tm is the mean lifetime, and λ i...
Q: What Is The Quantum Observer Effect?
A: Concept used: Quantum mechanics states a substance has dual behavior. It has both wave as well as p...
Q: The magnitude of the electric force between the two protons is 2.30 x10^-26 N. How far apart are the...
A: Coulomb's law or inverse law quantifies the force between two stationary charges. the force between...
Q: In the figure below, three connected blocks are pulled to the right on a horizontal frictionless tab...
A: Given: Force magnitude T3=71.2 Nm1=12.5 kgm2=23.5 kgm3=30.5 kg To find: (a) The magnitude of the acc...
Q: Consider a dumbbell consisting of two masses of m=200gm each at the ends of a massless rod of length...
A: Concept used: Kinetic energy and momentum remains conserved during an elastic collision.
Q: Explain why that’s the answer
A: Refractive index is the internal property of the medium which tells about the variation in speed of ...
Q: 5. Prove that: Oln T a) Os =C, OIn P alnT b) ), =C,n), aIn V
A:
Q: Drop an object freely from a height of 490 m. Calculate the time required to reach the ground and th...
A: Given: Height at which the object is s=490m. Initial velocity is u=30ms. Acceleration due to gravity...
Q: On a diffraction grating having 3660 lines per cm, light with a wavelength of 656 nm is incident per...
A: Let N denotes the number of the lines per cm in the grating, d denotes the width of the lines, λ den...
Q: Two spherical shells have a common center. The inner shell has radius R1 = 5,00 cm and charge q1 = +...
A:
Q: A 220 Vp is applied to the primary coil of a transformer of turn ratio (n1/n2 = 10: 2). If the secon...
A: Given: The input voltage in the primary coil is Vp = 220 V The ratio of the turns of the primary and...
Q: A gun is fired straight up. Assuming that the air drag on the bullet varies quadratically with speed...
A: Consider the upward motion. The upward force is given by, Here, m is the mass, is the upward accel...
Q: From a 50-lb block of ice initially at 25°F, 200 Btu of heat is removed. What is its final temperatu...
A: Let Q denotes the heat, T0 denotes the initial temperature, Tf denotes the final temperature, s deno...
Q: Subject:MMP
A:
Q: 1 Q 2. The pressure P of the atmosphere at an altitude z is given by dp -KịpY where k1 # 0 where y d...
A:
Q: 17.2 A block is puled up a rough incline by a string. Does the gravitational force do positive work,...
A: Introduction: The gravitational force on Earth is equal to the force the Earth exerts on you. At res...
Q: An ideal gas is brought through an isothermal compression process. The 5.00 mol of gas goes from an ...
A:
Q: In the problem of a particle in one-dimensional Infinite Square well, the number of nodes in 4, (x) ...
A: For a particle confined in one-dimensional infinite square well, the energy is quantized and the wav...
Q: The figure below shows a space hauler (H) initially traveling at 1,000 m/s relative to the sun. Usi...
A: As the system is isolated, the momentum of the center of mass doesn't change, so the principle of co...
Q: Problem An electric charge Q is distributed uniformly along a thick and enormously long conducting w...
A:
Q: Q7/ Two pistons of a hydraulic lift have diameters of 60 cm and 5 cm. What is the force exerted by t...
A:
Q: ?Which of the following statements is TRUE
A: We have to know the electromagnetic spectrum here.
Q: 3. Ignoring friction how much effort is required to lift the load?
A:
Q: 2. A very long tube of radius R is full of charged a) Sketch the electric field created by this char...
A: GIVEN THAT: A very long tube Of radius R is full of charged stuff with uniform positive charge per...
Q: Find the magnitude of the electric field intensity with a copper sample if: (a) the current density ...
A: (a) Given that, Current density, J= 106A/m2 The conductivity,σ for the Copper, has a standard value ...
Q: Construct the Lissajous figures for the following motions: (a) x = cos 2wt, y = sin 2wt. %3D (b) x =...
A:
Q: Under what conditions can we have (∇^2)*A = −µ*J? Prove the identity.
A: Let B→ be the magnetic field related to the magnetic vector potential A→ as: B→=∇×A→
Q: question in picture
A: Since, the element and resistance R of the LED are in series, the current IE through element is same...
Q: The figure below shows a two blocks which collide and then stick together. The mass of block 1 is 4...
A: Given, Mass of block1 ,m1=4.9kg,Mass of block 2,m2=3.2kg,velocity of block1,v1=4.6m/svelocity of blo...
Q: A hovering rescue helicopter has a container of supplies, with a weight of 1 960 N, hanging from a c...
A: We are authorized to answer three subparts at a time since you have not mentioned which part you are...
Q: An electric dipole located at the origin in free space has a moment p = 3āx 2āy + āz nC.m, find (a) ...
A: Given data, Electric dipole, p→=3i^-2j^+k^ nC.m therefor, its magnitude p=3i^-2j^+k^×10-9 C.m=9+4+...
Q: DE 3. Draw a line segment DE Rotate by 45 degrees (centered at (0, 0)) and then by 315 degrees (cent...
A: Concept used: Rotational transformation: When the initial system is moved through certain angle, thi...
Q: Now the winch inside the helicopter starts to pull the container upwards with an acceleration of 0,1...
A: Since the weight of the container is wc = 1960 N, the mass of the container can be calculated as: wc...
Q: Subject:MMP
A: Here we have to use divergence formula
Q: A sound meter records 95 dBA in a different location in the plant. What exposure time without hearin...
A: According the National Institute for Occupational Safety - NIOSH -The exposure to noise should be co...
Q: 8. The system consists of two concentric metal shells of radii R1 and R2 (R2> R1) with the corres...
A: (a) Self energy of the shell is given by qV2 where V is the potential of the shell created by charge...
Q: Two resistors with values of 6.0 Q and 12 Q are connected in parallel. This combination is connected...
A: Given data, Resistors R1=6 Ω and R2=12 Ω are connected in parallel and their combination is connecte...


Trending now
This is a popular solution!

Step by step
Solved in 2 steps with 1 images
