2010 Income Distribution up to $100,000 The following table shows the distribution of household incomes in 2010 for a sample of 1,000 households in a country with incomes up to $100,000. 0.3 0.25 0.2 0.15 0.1 0.05 (a) Let X be the (rounded) midpoint of a bracket in which a household falls. Find the relative frequency distribution of X, and graph its histogram. P P 0.3 0.25 0.2 Income Bracket ($) Households 0.15 0.1 0- 20,000- 40,000- 19,999 39,999 59,999 280 180 0.05 250 10,000 30,000 50,000 70,000 90,000 60,000- 80,000- 79,999 99,999 170 120 X A tol 10,000 30,000 50,000 70,000 90,000 0.3 Um.. Uma. 10,000 30,000 50,000 70,000 90,000 10,000 30,000 50,000 70,000 90,000 0.25 0.2 0.15 0.1 0.05 P 0.3 0.25 0.2 0.15 0.1 0.05 X (b) Shade the area of your histogram corresponding to the probability that a randomly selected household in the sample has a value of X above 50,000. What is this probability?
2010 Income Distribution up to $100,000 The following table shows the distribution of household incomes in 2010 for a sample of 1,000 households in a country with incomes up to $100,000. 0.3 0.25 0.2 0.15 0.1 0.05 (a) Let X be the (rounded) midpoint of a bracket in which a household falls. Find the relative frequency distribution of X, and graph its histogram. P P 0.3 0.25 0.2 Income Bracket ($) Households 0.15 0.1 0- 20,000- 40,000- 19,999 39,999 59,999 280 180 0.05 250 10,000 30,000 50,000 70,000 90,000 60,000- 80,000- 79,999 99,999 170 120 X A tol 10,000 30,000 50,000 70,000 90,000 0.3 Um.. Uma. 10,000 30,000 50,000 70,000 90,000 10,000 30,000 50,000 70,000 90,000 0.25 0.2 0.15 0.1 0.05 P 0.3 0.25 0.2 0.15 0.1 0.05 X (b) Shade the area of your histogram corresponding to the probability that a randomly selected household in the sample has a value of X above 50,000. What is this probability?

Glencoe Algebra 1, Student Edition, 9780079039897, 0079039898, 2018
18th Edition
ISBN:9780079039897
Author:Carter
Publisher:Carter
Chapter10: Statistics
Section10.4: Distributions Of Data
Problem 20PFA

Related questions
Question
100%
Finite Math - Random Variables & Distributions
Can you please solve this without technology and show the step-by-step process?
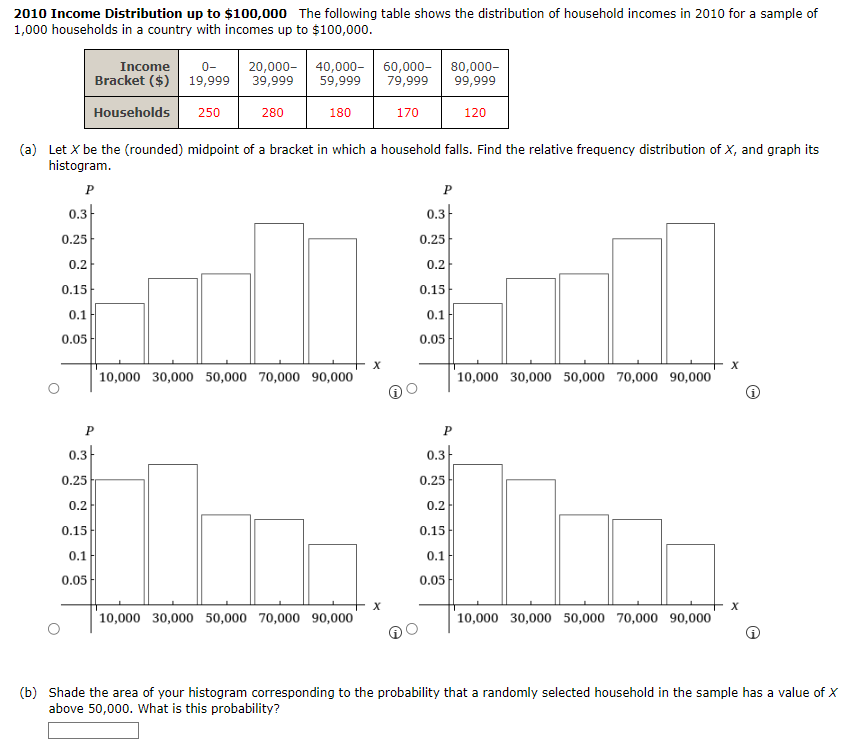
Transcribed Image Text:2010 Income Distribution up to $100,000 The following table shows the distribution of household incomes in 2010 for a sample of
1,000 households in a country with incomes up to $100,000.
0.3
0.25
0.2
0.15
0.1
0.05
(a) Let X be the (rounded) midpoint of a bracket in which a household falls. Find the relative frequency distribution of X, and graph its
histogram.
P
P
Income
Bracket ($)
Households
0.3
0.25
0- 20,000-
19,999 39,999
250
280
0.2
Um
0.15
0.1
0.05
40,000- 60,000- 80,000-
59,999 79,999 99,999
180
170
120
10,000 30,000 50,000 70,000 90,000
10,000 30,000 50,000 70,000 90,000
X
X
P
0.3
0.2
0.15
L
0.1
0.05
0.25
P
0.3
0.25
0.2
0.15
0.1
0.05
10,000 30,000 50,000 70,000 90,000
10,000 30,000 50,000 70,000 90,000
X
X
(b) Shade the area of your histogram corresponding to the probability that a randomly selected household in the sample has a value of X
above 50,000. What is this probability?
Expert Solution
This question has been solved!
Explore an expertly crafted, step-by-step solution for a thorough understanding of key concepts.

This is a popular solution!

Trending now
This is a popular solution!

Step by step
Solved in 4 steps with 2 images

Recommended textbooks for you
Glencoe Algebra 1, Student Edition, 9780079039897…
Algebra
ISBN:
9780079039897
Author:
Carter
Publisher:
McGraw Hill

Big Ideas Math A Bridge To Success Algebra 1: Stu…
Algebra
ISBN:
9781680331141
Author:
HOUGHTON MIFFLIN HARCOURT
Publisher:
Houghton Mifflin Harcourt
Glencoe Algebra 1, Student Edition, 9780079039897…
Algebra
ISBN:
9780079039897
Author:
Carter
Publisher:
McGraw Hill
Big Ideas Math A Bridge To Success Algebra 1: Stu…
Algebra
ISBN:
9781680331141
Author:
HOUGHTON MIFFLIN HARCOURT
Publisher:
Houghton Mifflin Harcourt