27.An employee has been asked to decide which machine to choose from four possibilities. The purchase and installation cost for each machine is identical. The decision tree below describes the conditions and expected values. Which machine to purchase? Machine A 111 O Machine D Machine B O Machine A Machine C Machine B Machine C Machine D Increase productivity $100,000 Increase productivity $50,000 Increase productivity $100,000 No increase in productivity Increase productivity $50,000 Increase productivity $25,000 Increase productivity $250,000 Decrease productivity $50,000 Probability 0.25 Probability 0.75 Probability 0.50 Probability 0.50 Probability 0.40 Probability 0.60 Probability 0.25 Probability 0.75 $62,500 $50,000 $35,000 5525,000 100,00 Which machine should this employee select to assure the board of directors that there is no likelihood of a reduction in productivity?
27.An employee has been asked to decide which machine to choose from four possibilities. The purchase and installation cost for each machine is identical. The decision tree below describes the conditions and expected values. Which machine to purchase? Machine A 111 O Machine D Machine B O Machine A Machine C Machine B Machine C Machine D Increase productivity $100,000 Increase productivity $50,000 Increase productivity $100,000 No increase in productivity Increase productivity $50,000 Increase productivity $25,000 Increase productivity $250,000 Decrease productivity $50,000 Probability 0.25 Probability 0.75 Probability 0.50 Probability 0.50 Probability 0.40 Probability 0.60 Probability 0.25 Probability 0.75 $62,500 $50,000 $35,000 5525,000 100,00 Which machine should this employee select to assure the board of directors that there is no likelihood of a reduction in productivity?

Glencoe Algebra 1, Student Edition, 9780079039897, 0079039898, 2018
18th Edition
ISBN:9780079039897
Author:Carter
Publisher:Carter
Chapter10: Statistics
Section10.6: Summarizing Categorical Data
Problem 27PPS

Related questions
Question
Please answer both.
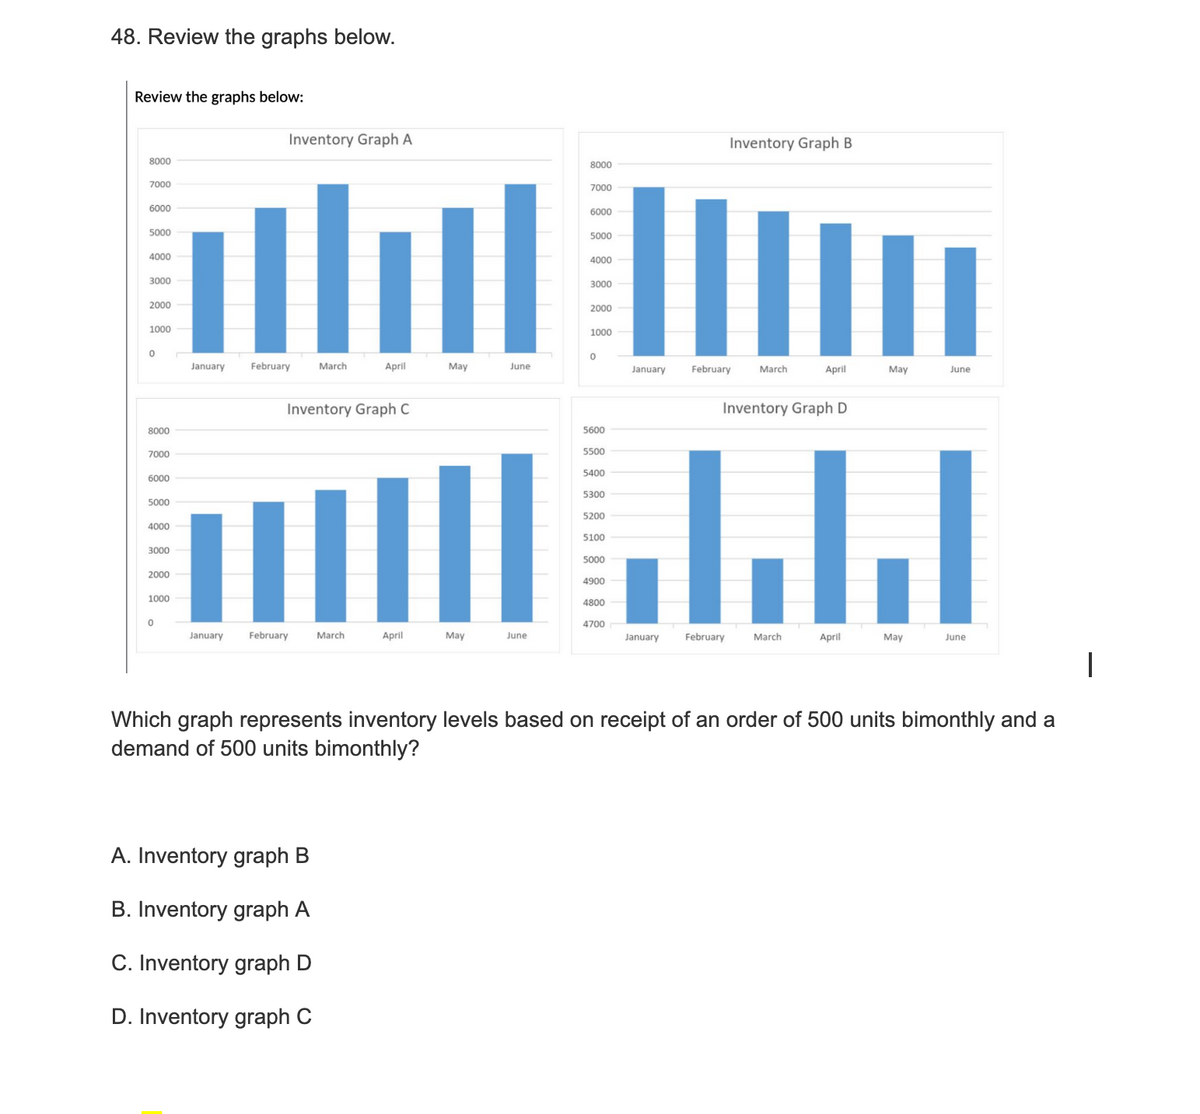
Transcribed Image Text:48. Review the graphs below.
Review the graphs below:
8000
7000
6000
5000
4000
3000
2000
1000
0
8000
7000
6000
5000
4000
3000
2000
1000
0
January
January
Inventory Graph A
February
March
Inventory Graph C
11
February
A. Inventory graph B
B. Inventory graph A
C. Inventory graph D
D. Inventory graph C
April
March
April
Il
May
May
June
June
8000
7000
6000
5000
4000
3000
2000
1000
0
5600
5500
5400
5300
5200
5100
5000
4900
4800
4700
January
January
Inventory Graph B
February March
Inventory Graph D
February
April
.l.l.l
March
May
April
June
May
June
I
Which graph represents inventory levels based on receipt of an order of 500 units bimonthly and a
demand of 500 units bimonthly?
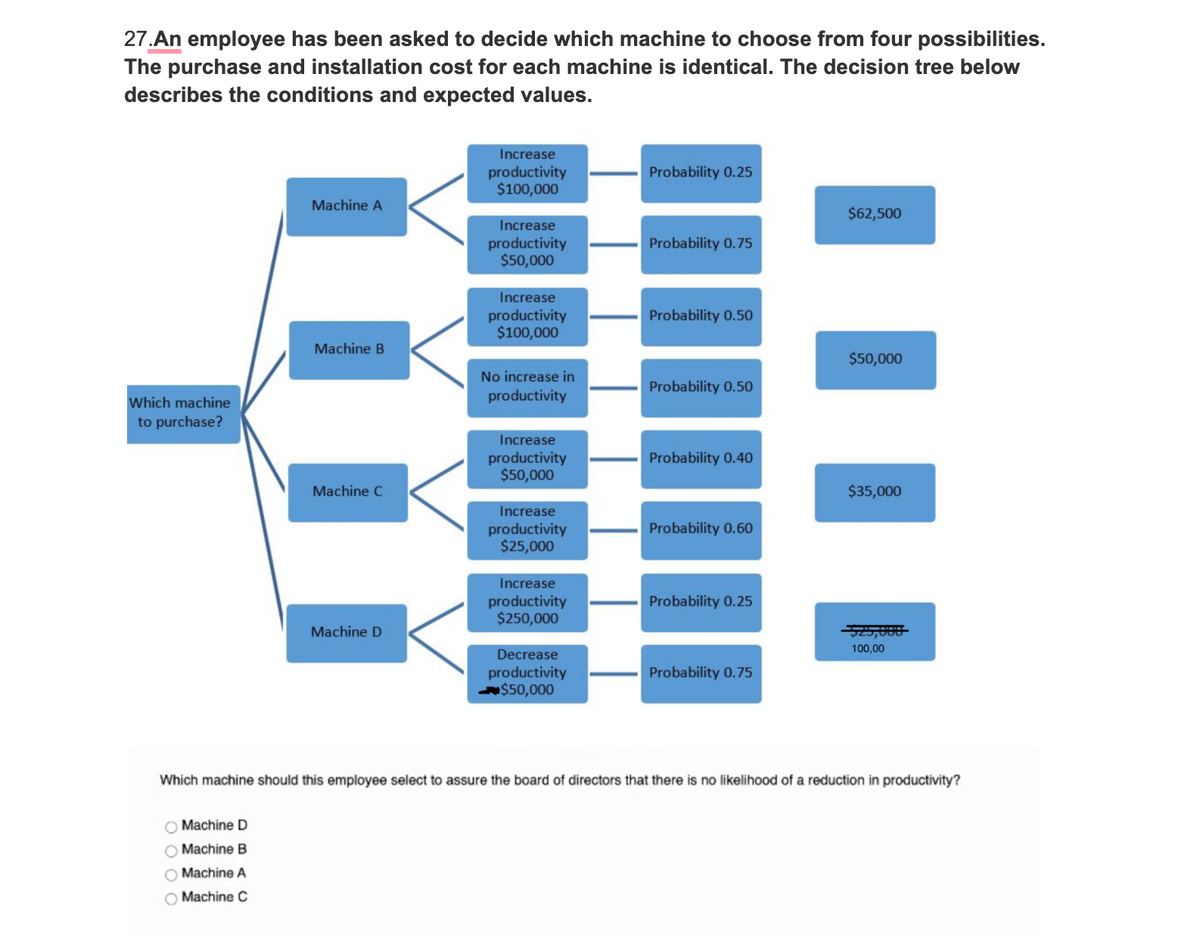
Transcribed Image Text:27.An employee has been asked to decide which machine to choose from four possibilities.
The purchase and installation cost for each machine is identical. The decision tree below
describes the conditions and expected values.
Which machine
to purchase?
Machine A
O Machine D
O Machine B
O Machine A
O Machine C
[
Machine B
Machine C
Machine D
Increase
productivity
$100,000
Increase
productivity
$50,000
Increase
productivity
$100,000
No increase in
productivity
Increase
productivity
$50,000
Increase
productivity
$25,000
Increase
productivity
$250,000
Decrease
productivity
$50,000
Probability 0.25
Probability 0.75
Probability 0.50
Probability 0.50
Probability 0.40
Probability 0.60
Probability 0.25
Probability 0.75
$62,500
$50,000
$35,000
5,000
100,00
Which machine should this employee select to assure the board of directors that there is no likelihood of a reduction in productivity?
Expert Solution
This question has been solved!
Explore an expertly crafted, step-by-step solution for a thorough understanding of key concepts.

Step by step
Solved in 3 steps with 1 images

Recommended textbooks for you
Glencoe Algebra 1, Student Edition, 9780079039897…
Algebra
ISBN:
9780079039897
Author:
Carter
Publisher:
McGraw Hill
Glencoe Algebra 1, Student Edition, 9780079039897…
Algebra
ISBN:
9780079039897
Author:
Carter
Publisher:
McGraw Hill