3- 2- y= g(x)- 1. R S 1 2 y = f(x) 5- 4+ 3+ 2 14 0 T 5) = (8(x))² HI 1 2 3 2. The function f is defined by f(x) = 3(1+x)05cos (2) for 0≤x≤ 3. The function g is continuous and decreasing for 0≤x≤ 3 with g(3) = 0. The figure above on the left shows the graphs of f and g and the regions R and S. R is the region bounded by the graph of g and the x- and y-axes. Region R has arca 3.24125. S is the region bounded by the y-axis and the graphs of f and g. The figure above on the right shows the graph of y = (g(x))2 and the region T. 7' is the region bounded by the graph of y = (g(x))2 and the x- and y-axes. Region 7 has area 5.32021. (a) Find the area of region S. (b) Find the volume of the solid generated when region S is revolved about the horizontal line y = -3. (c) Region S is the base of a solid. For this solid, cach cross section perpendicular to the x-axis is a rectangle whose height is 7 times the length of its base in region S. Write, but do not evaluate, an integral expression for the volume of this solid.
3- 2- y= g(x)- 1. R S 1 2 y = f(x) 5- 4+ 3+ 2 14 0 T 5) = (8(x))² HI 1 2 3 2. The function f is defined by f(x) = 3(1+x)05cos (2) for 0≤x≤ 3. The function g is continuous and decreasing for 0≤x≤ 3 with g(3) = 0. The figure above on the left shows the graphs of f and g and the regions R and S. R is the region bounded by the graph of g and the x- and y-axes. Region R has arca 3.24125. S is the region bounded by the y-axis and the graphs of f and g. The figure above on the right shows the graph of y = (g(x))2 and the region T. 7' is the region bounded by the graph of y = (g(x))2 and the x- and y-axes. Region 7 has area 5.32021. (a) Find the area of region S. (b) Find the volume of the solid generated when region S is revolved about the horizontal line y = -3. (c) Region S is the base of a solid. For this solid, cach cross section perpendicular to the x-axis is a rectangle whose height is 7 times the length of its base in region S. Write, but do not evaluate, an integral expression for the volume of this solid.

Algebra & Trigonometry with Analytic Geometry
13th Edition
ISBN:9781133382119
Author:Swokowski
Publisher:Swokowski
Chapter5: Inverse, Exponential, And Logarithmic Functions
Section5.6: Exponential And Logarithmic Equations
Problem 64E

Related questions
Question
the function f is defined by f(x)=3(1 x)^0.5cos(pix/6)
i need the solution
Transcribed Image Text:6.
-y%3f(x)
3.
44
%3D
24
3-
y = g(x)-
1
R.
2-
1-
1 2
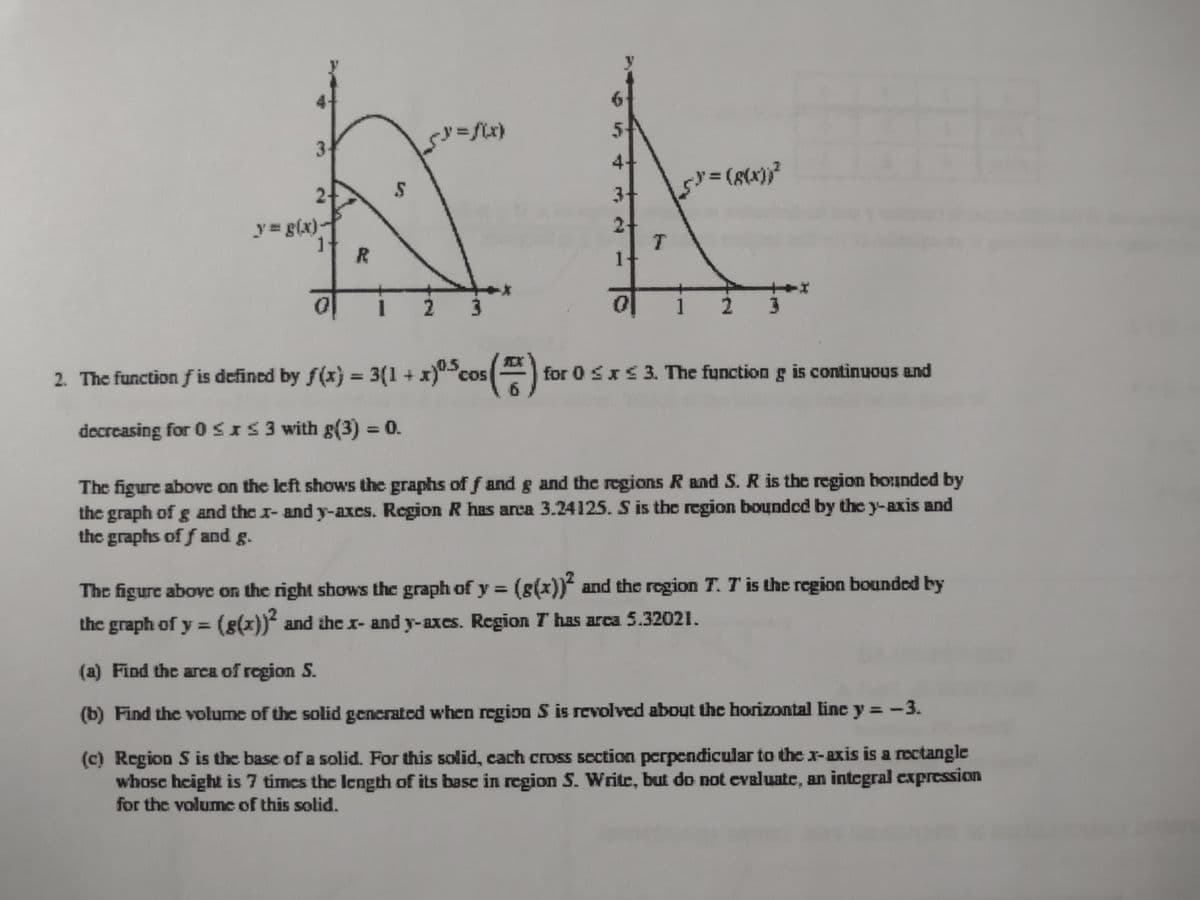
2. The function f is defined by f(x} = 3(1 + x)""cos
()
COS
for 0 Sx£3. The function g is continuous and
decreasing for 0SIS3 with g(3) = 0.
%3D
The figure above on the left shows the graphs of f and g and the regions R and S. R is the region bo:unded by
the graph of g and the x- and y-axcs. Region R has arca 3.24125. S is the region bounded by the y-axis and
the graphs of f and g.
The figure above on the right shows the graph of y = (g(x)) and the region T. T is the region bounded by
%3D
the graph of y = (g(x)) and thex- and y-axes. Region T has arca 5.32021.
%3D
(a) Find the arca of region S.
(b) Find the volume of the solid generated when region S is revolved about the horizontal line y = -3.
(c) Region S is the base of a solid. For this solid, cach cross section perpendicular to the x-axis is a roctangle
whosc height is 7 times the Iength of its basc in region S. Write, but do not evaluate, an integral expression
for the volume of this solid.
Expert Solution
This question has been solved!
Explore an expertly crafted, step-by-step solution for a thorough understanding of key concepts.

This is a popular solution!

Trending now
This is a popular solution!

Step by step
Solved in 3 steps with 3 images

Recommended textbooks for you
Algebra & Trigonometry with Analytic Geometry
Algebra
ISBN:
9781133382119
Author:
Swokowski
Publisher:
Cengage

Functions and Change: A Modeling Approach to Coll…
Algebra
ISBN:
9781337111348
Author:
Bruce Crauder, Benny Evans, Alan Noell
Publisher:
Cengage Learning
Algebra & Trigonometry with Analytic Geometry
Algebra
ISBN:
9781133382119
Author:
Swokowski
Publisher:
Cengage
Functions and Change: A Modeling Approach to Coll…
Algebra
ISBN:
9781337111348
Author:
Bruce Crauder, Benny Evans, Alan Noell
Publisher:
Cengage Learning