3) The Venn diagram below represents the modules students are taking. . S is the event students study Statistics . M is the event students study Mathematics F is the event students study Further Maths . F 15 0 24 32 18 S M a. How many students are there in total?
3) The Venn diagram below represents the modules students are taking. . S is the event students study Statistics . M is the event students study Mathematics F is the event students study Further Maths . F 15 0 24 32 18 S M a. How many students are there in total?

Algebra and Trigonometry (MindTap Course List)
4th Edition
ISBN:9781305071742
Author:James Stewart, Lothar Redlin, Saleem Watson
Publisher:James Stewart, Lothar Redlin, Saleem Watson
Chapter14: Counting And Probability
Section14.CR: Chapter Review
Problem 7CC: a What is meant by the conditional probability of E given F? How is this probability calculated? b...

Related questions
Question
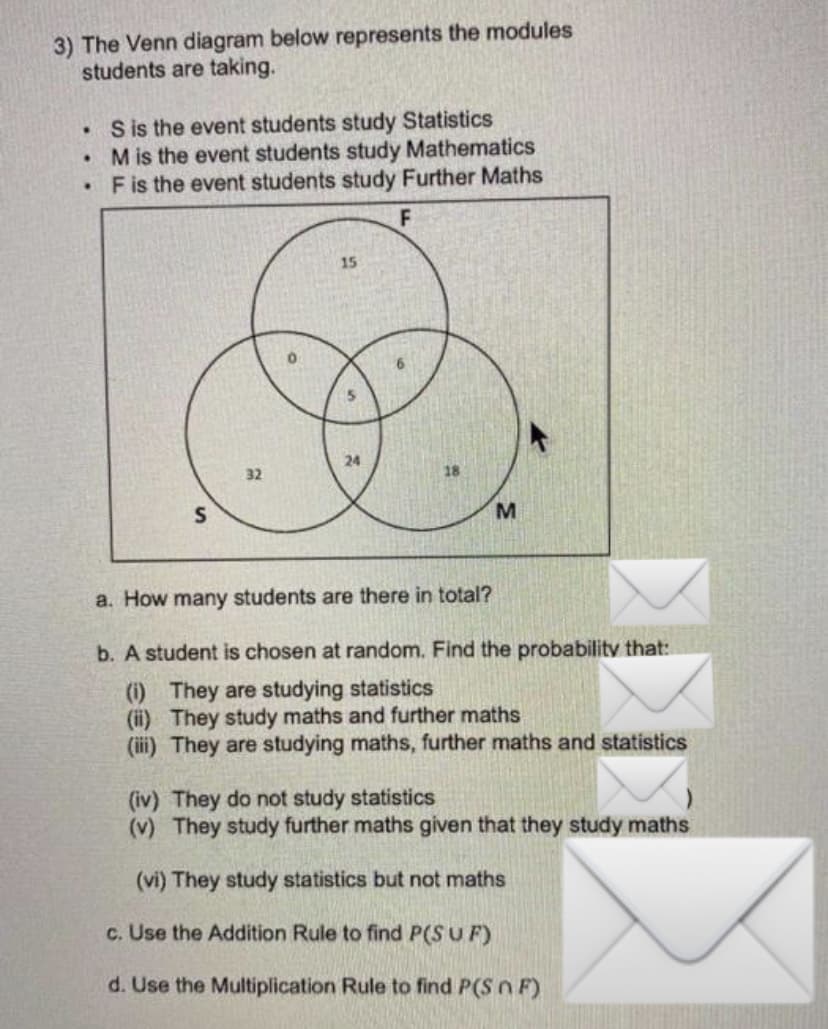
Transcribed Image Text:3) The Venn diagram below represents the modules
students are taking.
.
S is the event students study Statistics
.
M is the event students study Mathematics
.
F is the event students study Further Maths
F
15
0
5.
24
32
S
M
a. How many students are there in total?
b. A student is chosen at random. Find the probability that:
(i) They are studying statistics
(ii) They study maths and further maths
(iii) They are studying maths, further maths and statistics
(iv) They do not study statistics
(v) They study further maths given that they study maths
(vi) They study statistics but not maths
c. Use the Addition Rule to find P(SUF)
d. Use the Multiplication Rule to find P(Sn F)
Expert Solution
This question has been solved!
Explore an expertly crafted, step-by-step solution for a thorough understanding of key concepts.

Step by step
Solved in 2 steps with 2 images

Recommended textbooks for you
Algebra and Trigonometry (MindTap Course List)
Algebra
ISBN:
9781305071742
Author:
James Stewart, Lothar Redlin, Saleem Watson
Publisher:
Cengage Learning

Algebra and Trigonometry (MindTap Course List)
Algebra
ISBN:
9781305071742
Author:
James Stewart, Lothar Redlin, Saleem Watson
Publisher:
Cengage Learning