3. The following data were collected in an experiment to study the relationship between excursion (in KPa) and wear (in mg). I 150 175 200 225 250 275 y 10.4 12.4 14.9 15.0 13.9 11.9 (a) Plot the data. What is the name of the plot? (b) Verify that the best prediction equation is given by: y = -32.445714 + 0.431543r-0.000983². The calculator steps are: STAT-CALC-5 QuadReg L1,L2, say, ENTER. (c) Graph the residual plot.
3. The following data were collected in an experiment to study the relationship between excursion (in KPa) and wear (in mg). I 150 175 200 225 250 275 y 10.4 12.4 14.9 15.0 13.9 11.9 (a) Plot the data. What is the name of the plot? (b) Verify that the best prediction equation is given by: y = -32.445714 + 0.431543r-0.000983². The calculator steps are: STAT-CALC-5 QuadReg L1,L2, say, ENTER. (c) Graph the residual plot.

Glencoe Algebra 1, Student Edition, 9780079039897, 0079039898, 2018
18th Edition
ISBN:9780079039897
Author:Carter
Publisher:Carter
Chapter10: Statistics
Section: Chapter Questions
Problem 22SGR

Related questions
Question
Kindly solve it Asap!
Transcribed Image Text:4 of 9
3
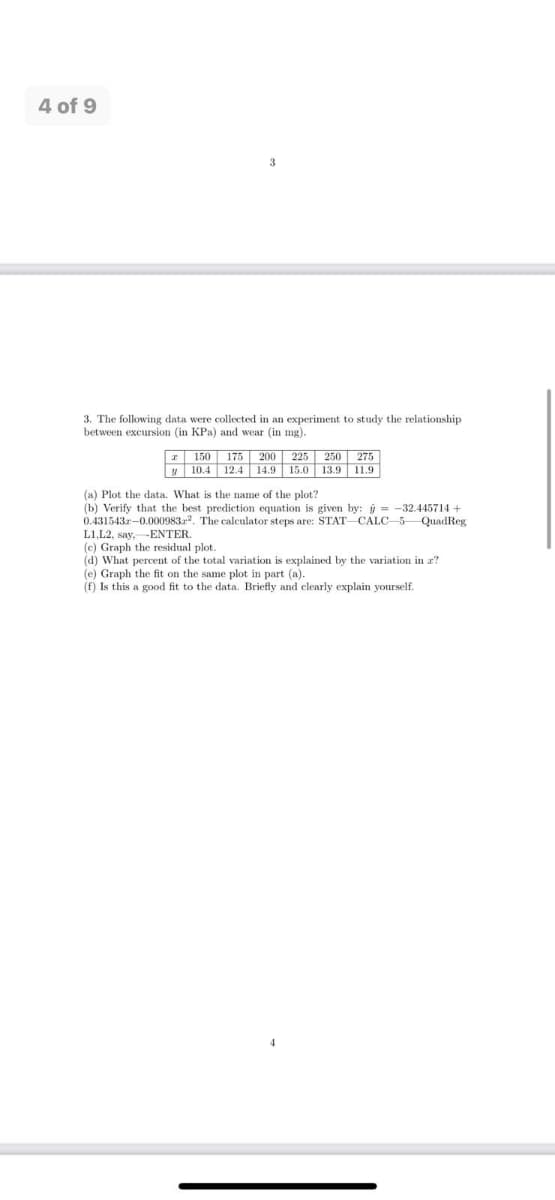
3. The following data were collected in an experiment to study the relationship
between excursion (in KPa) and wear (in mg).
2150 175 200 225 250 275
y 10.4 12.4 14.9 15.0 13.9 11.9
(a) Plot the data. What is the name of the plot?
(b) Verify that the best prediction equation is given by: = -32.445714 +
0.431543r-0.0009832. The calculator steps are: STAT CALC 5 QuadReg
L1,L2, say, ENTER.
(e) Graph the residual plot.
(d) What percent of the total variation is explained by the variation in a?
(e) Graph the fit on the same plot in part (a).
(f) Is this a good fit to the data. Briefly and clearly explain yourself.
Expert Solution
This question has been solved!
Explore an expertly crafted, step-by-step solution for a thorough understanding of key concepts.

Step by step
Solved in 4 steps with 4 images

Recommended textbooks for you
Glencoe Algebra 1, Student Edition, 9780079039897…
Algebra
ISBN:
9780079039897
Author:
Carter
Publisher:
McGraw Hill
Glencoe Algebra 1, Student Edition, 9780079039897…
Algebra
ISBN:
9780079039897
Author:
Carter
Publisher:
McGraw Hill