3. The graph below represents a plot of the location versus time for an object. Use this graph to answer the following questions: a. What is the displacement of the object between 0.0 s and 32 s? b. What is the average velocity of the object between 4.0 s and 20 s? C. What is the average velocity of the object between 20 s and 30 s? d. What is the average velocity of the object between 2.0 s and 26 s?
3. The graph below represents a plot of the location versus time for an object. Use this graph to answer the following questions: a. What is the displacement of the object between 0.0 s and 32 s? b. What is the average velocity of the object between 4.0 s and 20 s? C. What is the average velocity of the object between 20 s and 30 s? d. What is the average velocity of the object between 2.0 s and 26 s?

Related questions
Question
100%
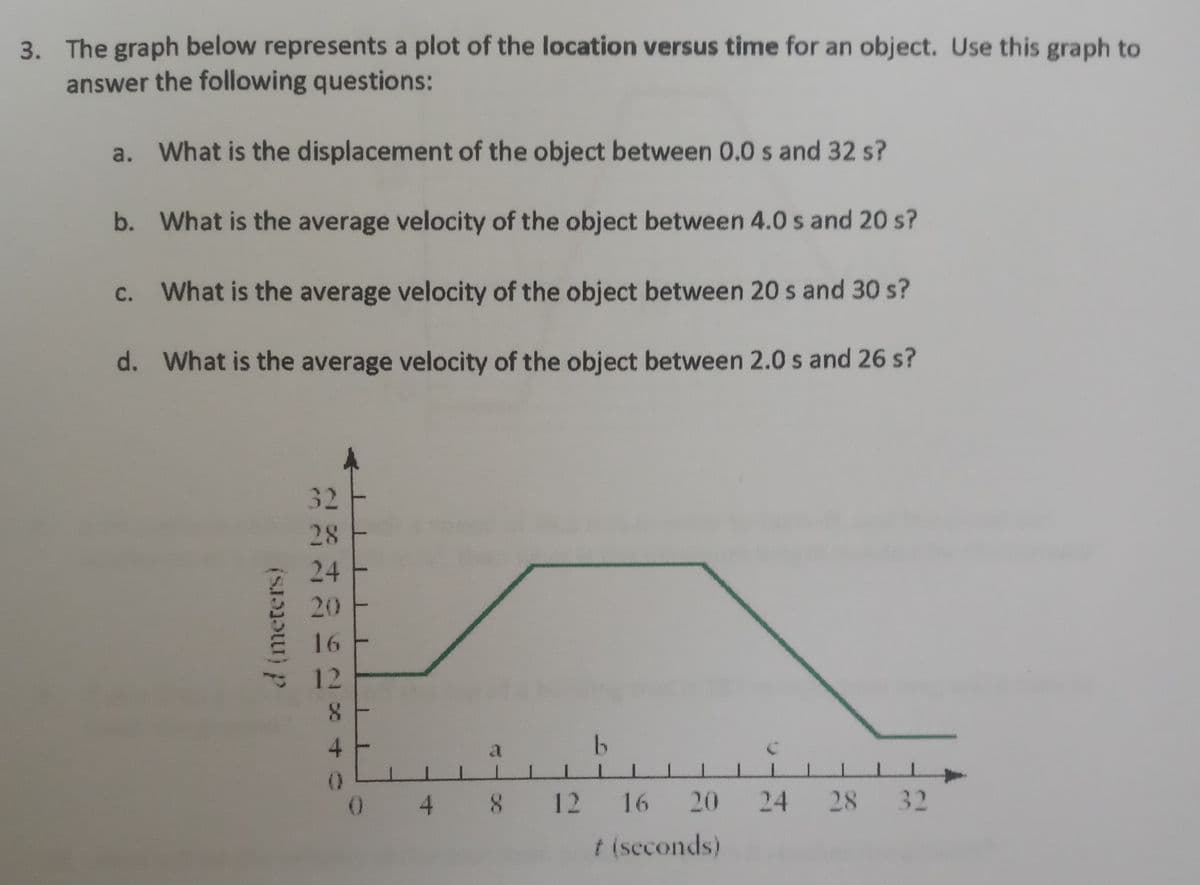
Transcribed Image Text:3. The graph below represents a plot of the location versus time for an object. Use this graph to
answer the following questions:
a. What is the displacement of the object between 0.0 s and 32 s?
b.
What is the average velocity of the object between 4.0 s and 20 s?
What is the average velocity of the object between 20 s and 30 s?
d. What is the average velocity of the object between 2.0 s and 26 s?
C.
d (meters)
222202840
32
12
a
0 4 8 12 16 20 24 28 32
t (seconds)
Expert Solution
This question has been solved!
Explore an expertly crafted, step-by-step solution for a thorough understanding of key concepts.

This is a popular solution!

Trending now
This is a popular solution!

Step by step
Solved in 3 steps
