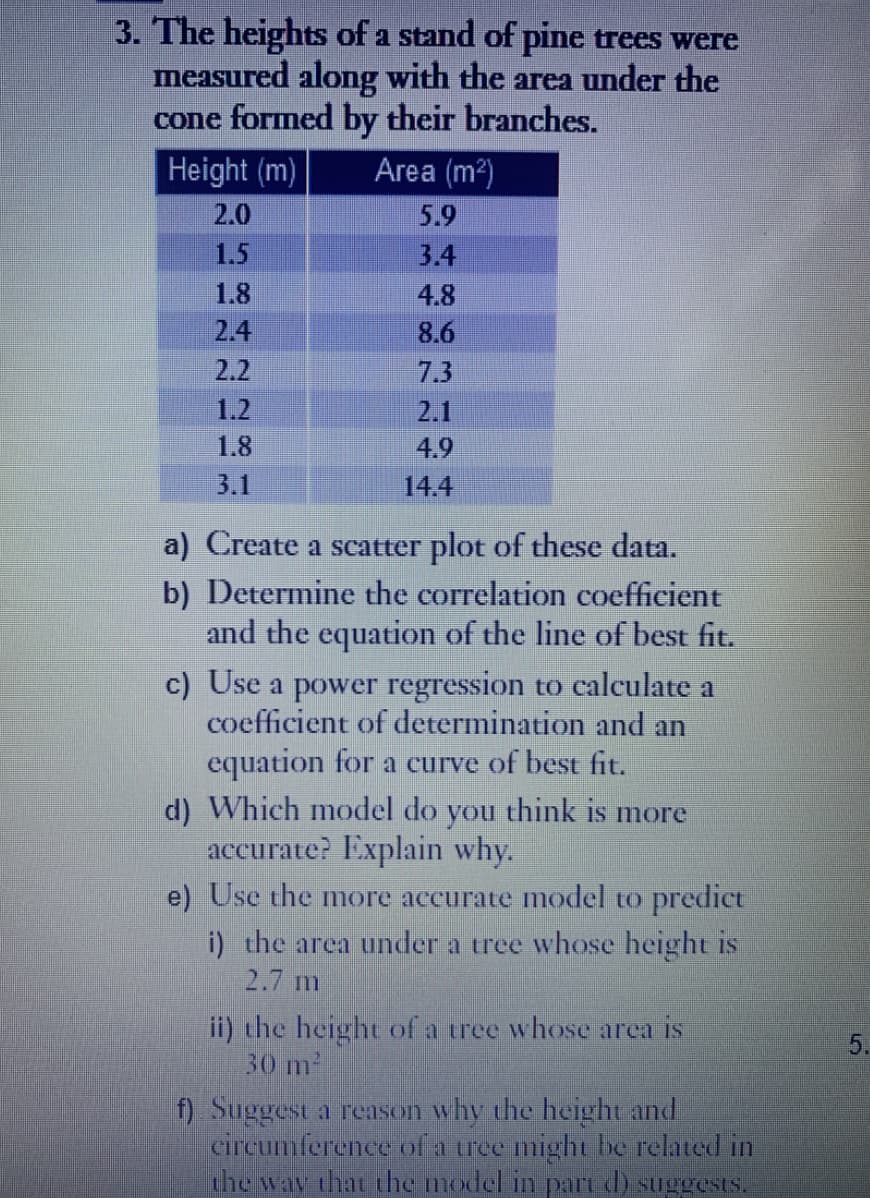
3. The heights of a stand of pine trees were measured along with the area under the cone formed by their branches. Height (m) Area (m²) 2.0 5.9 1.5 3.4 1.8 4.8 2.4 8.6 2.2 7.3 1.2 2.1 1.8 4.9 3.1 14.4 a) Create a scatter plot of these data. b) Determine the correlation coefficient and the equation of the line of best fit. c) Use a power regression to calculate a coefficient of determination and an equation for a curve of best fit. d) Which model do you think is more accurate? Explain why. e) Use the more accurate model to predict i) the area under a tree whose height is 2.7 m ii) the height of a tree whose area is 30 m² f) Suggest a reason why the height and circumference of a tree might be related in the way that the model in part d) suggests. 5
3. The heights of a stand of pine trees were measured along with the area under the cone formed by their branches. Height (m) Area (m²) 2.0 5.9 1.5 3.4 1.8 4.8 2.4 8.6 2.2 7.3 1.2 2.1 1.8 4.9 3.1 14.4 a) Create a scatter plot of these data. b) Determine the correlation coefficient and the equation of the line of best fit. c) Use a power regression to calculate a coefficient of determination and an equation for a curve of best fit. d) Which model do you think is more accurate? Explain why. e) Use the more accurate model to predict i) the area under a tree whose height is 2.7 m ii) the height of a tree whose area is 30 m² f) Suggest a reason why the height and circumference of a tree might be related in the way that the model in part d) suggests. 5

Glencoe Algebra 1, Student Edition, 9780079039897, 0079039898, 2018
18th Edition
ISBN:9780079039897
Author:Carter
Publisher:Carter
Chapter10: Statistics
Section10.3: Measures Of Spread
Problem 1GP

Related questions
Question
Solve d, e, and f
Transcribed Image Text:3. The heights of a stand of pine trees were
measured along with the area under the
cone formed by their branches.
Height (m)
Area (m²)
2.0
5.9
1.5
3.4
1.8
4.8
2.4
8.6
2.2
7.3
1.2
2.1
1.8
4.9
3.1
14.4
a) Create a scatter plot of these data.
b) Determine the correlation coefficient
and the equation of the line of best fit.
c) Use a power regression to calculate a
coefficient of determination and an
equation for a curve of best fit.
d) Which model do you think is more
accurate? Explain why.
e) Use the more accurate model to predict
i) the area under a tree whose height is
2.7 m
ii) the height of a tree whose area is
30 m²
f). Suggest a reason why the height and
circumference of a tree might be related in
the way that the model in part d) suggests.
5.
Expert Solution

Step by step
Solved in 9 steps with 4 images

Recommended textbooks for you
Glencoe Algebra 1, Student Edition, 9780079039897…
Algebra
ISBN:
9780079039897
Author:
Carter
Publisher:
McGraw Hill

Big Ideas Math A Bridge To Success Algebra 1: Stu…
Algebra
ISBN:
9781680331141
Author:
HOUGHTON MIFFLIN HARCOURT
Publisher:
Houghton Mifflin Harcourt
Glencoe Algebra 1, Student Edition, 9780079039897…
Algebra
ISBN:
9780079039897
Author:
Carter
Publisher:
McGraw Hill
Big Ideas Math A Bridge To Success Algebra 1: Stu…
Algebra
ISBN:
9781680331141
Author:
HOUGHTON MIFFLIN HARCOURT
Publisher:
Houghton Mifflin Harcourt