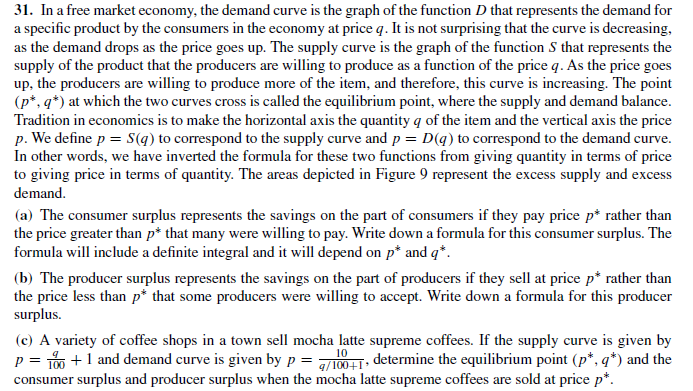
31. In a free market economy, the demand curve is the graph of the function D that represents the demand for a specific product by the consumers in the economy at price q. It is not surprising that the curve is decreasing, as the demand drops as the price goes up. The supply curve is the graph of the function S that represents the supply of the product that the producers are willing to produce as a function of the price q. As the price goes up, the producers are willing to produce more of the item, and therefore, this curve is increasing. The point (p*, q*) at which the two curves cross is called the equilibrium point, where the supply and demand balance. Tradition in economics is to make the horizontal axis the quantity q of the item and the vertical axis the price p. We define p = S(q) to correspond to the supply curve and p = D(q) to correspond to the demand curve. In other words, we have inverted the formula for these two functions from giving quantity in terms of price to giving price in terms of quantity. The areas depicted in Figure 9 represent the excess supply and excess demand. (a) The consumer surplus represents the savings on the part of consumers if they pay price p* rather than the price greater than p* that many were willing to pay. Write down a formula for this consumer surplus. The formula will include a definite integral and it will depend on p* and q*. (b) The producer surplus represents the savings on the part of producers if they sell at price p* rather than the price less than p* that some producers were willing to accept. Write down a formula for this producer surplus. (c) A variety of coffee shops in a town sell mocha latte supreme coffees. If the supply curve is given by p = 1 +1 and demand curve is given by p = 001. determine the equilibrium point (p*, q*) and the consumer surplus and producer surplus when the mocha latte supreme coffees are sold at price p*. Price p p= S(q) Consumer surplus p= D(q) Producer surplus Quantity q FIGURE 9 The supply and demand curves.
31. In a free market economy, the demand curve is the graph of the function D that represents the demand for a specific product by the consumers in the economy at price q. It is not surprising that the curve is decreasing, as the demand drops as the price goes up. The supply curve is the graph of the function S that represents the supply of the product that the producers are willing to produce as a function of the price q. As the price goes up, the producers are willing to produce more of the item, and therefore, this curve is increasing. The point (p*, q*) at which the two curves cross is called the equilibrium point, where the supply and demand balance. Tradition in economics is to make the horizontal axis the quantity q of the item and the vertical axis the price p. We define p = S(q) to correspond to the supply curve and p = D(q) to correspond to the demand curve. In other words, we have inverted the formula for these two functions from giving quantity in terms of price to giving price in terms of quantity. The areas depicted in Figure 9 represent the excess supply and excess demand. (a) The consumer surplus represents the savings on the part of consumers if they pay price p* rather than the price greater than p* that many were willing to pay. Write down a formula for this consumer surplus. The formula will include a definite integral and it will depend on p* and q*. (b) The producer surplus represents the savings on the part of producers if they sell at price p* rather than the price less than p* that some producers were willing to accept. Write down a formula for this producer surplus. (c) A variety of coffee shops in a town sell mocha latte supreme coffees. If the supply curve is given by p = 1 +1 and demand curve is given by p = 001. determine the equilibrium point (p*, q*) and the consumer surplus and producer surplus when the mocha latte supreme coffees are sold at price p*. Price p p= S(q) Consumer surplus p= D(q) Producer surplus Quantity q FIGURE 9 The supply and demand curves.

Calculus: Early Transcendentals
8th Edition
ISBN:9781285741550
Author:James Stewart
Publisher:James Stewart
Chapter1: Functions And Models
Section: Chapter Questions
Problem 1RCC: (a) What is a function? What are its domain and range? (b) What is the graph of a function? (c) How...

Related questions
Question
Transcribed Image Text:31. In a free market economy, the demand curve is the graph of the function D that represents the demand for
a specific product by the consumers in the economy at price q. It is not surprising that the curve is decreasing,
as the demand drops as the price goes up. The supply curve is the graph of the function S that represents the
supply of the product that the producers are willing to produce as a function of the price q. As the price goes
up, the producers are willing to produce more of the item, and therefore, this curve is increasing. The point
(p*, q*) at which the two curves cross is called the equilibrium point, where the supply and demand balance.
Tradition in economics is to make the horizontal axis the quantity q of the item and the vertical axis the price
p. We define p = S(q) to correspond to the supply curve and p = D(q) to correspond to the demand curve.
In other words, we have inverted the formula for these two functions from giving quantity in terms of price
to giving price in terms of quantity. The areas depicted in Figure 9 represent the excess supply and excess
demand.
(a) The consumer surplus represents the savings on the part of consumers if they pay price p* rather than
the price greater than p* that many were willing to pay. Write down a formula for this consumer surplus. The
formula will include a definite integral and it will depend on p* and q*.
(b) The producer surplus represents the savings on the part of producers if they sell at price p* rather than
the price less than p* that some producers were willing to accept. Write down a formula for this producer
surplus.
(c) A variety of coffee shops in a town sell mocha latte supreme coffees. If the supply curve is given by
p = 1 +1 and demand curve is given by p = 001. determine the equilibrium point (p*, q*) and the
consumer surplus and producer surplus when the mocha latte supreme coffees are sold at price p*.
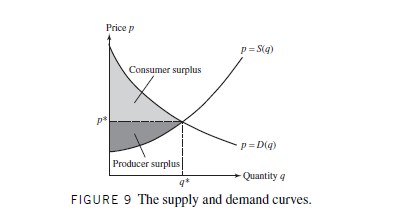
Transcribed Image Text:Price p
p= S(q)
Consumer surplus
p= D(q)
Producer surplus
Quantity q
FIGURE 9 The supply and demand curves.
Expert Solution
This question has been solved!
Explore an expertly crafted, step-by-step solution for a thorough understanding of key concepts.

This is a popular solution!

Trending now
This is a popular solution!

Step by step
Solved in 4 steps with 7 images

Recommended textbooks for you
Calculus: Early Transcendentals
Calculus
ISBN:
9781285741550
Author:
James Stewart
Publisher:
Cengage Learning

Thomas' Calculus (14th Edition)
Calculus
ISBN:
9780134438986
Author:
Joel R. Hass, Christopher E. Heil, Maurice D. Weir
Publisher:
PEARSON

Calculus: Early Transcendentals (3rd Edition)
Calculus
ISBN:
9780134763644
Author:
William L. Briggs, Lyle Cochran, Bernard Gillett, Eric Schulz
Publisher:
PEARSON
Calculus: Early Transcendentals
Calculus
ISBN:
9781285741550
Author:
James Stewart
Publisher:
Cengage Learning
Thomas' Calculus (14th Edition)
Calculus
ISBN:
9780134438986
Author:
Joel R. Hass, Christopher E. Heil, Maurice D. Weir
Publisher:
PEARSON
Calculus: Early Transcendentals (3rd Edition)
Calculus
ISBN:
9780134763644
Author:
William L. Briggs, Lyle Cochran, Bernard Gillett, Eric Schulz
Publisher:
PEARSON

Calculus: Early Transcendentals
Calculus
ISBN:
9781319050740
Author:
Jon Rogawski, Colin Adams, Robert Franzosa
Publisher:
W. H. Freeman


Calculus: Early Transcendental Functions
Calculus
ISBN:
9781337552516
Author:
Ron Larson, Bruce H. Edwards
Publisher:
Cengage Learning