4 -4 -3 -2 -1 1 2 3 4 5 -2 -3 -4 -5 The plot above is created with the parametric equations Sæ(t) ly(t) = c sin(dt) = a cos(bt) To acheive this graph, a = b = %3D C = d = Hint: b and d are both whole numbers from 1 to 3
4 -4 -3 -2 -1 1 2 3 4 5 -2 -3 -4 -5 The plot above is created with the parametric equations Sæ(t) ly(t) = c sin(dt) = a cos(bt) To acheive this graph, a = b = %3D C = d = Hint: b and d are both whole numbers from 1 to 3

Algebra and Trigonometry (MindTap Course List)
4th Edition
ISBN:9781305071742
Author:James Stewart, Lothar Redlin, Saleem Watson
Publisher:James Stewart, Lothar Redlin, Saleem Watson
Chapter8: Polar Coordinates And Parametric Equations
Section8.4: Plane Curves And Parametric Equations
Problem 59E

Related questions
Question
100%
Transcribed Image Text:4
-3 -2 -1
-2
-3
-4
-5
-6
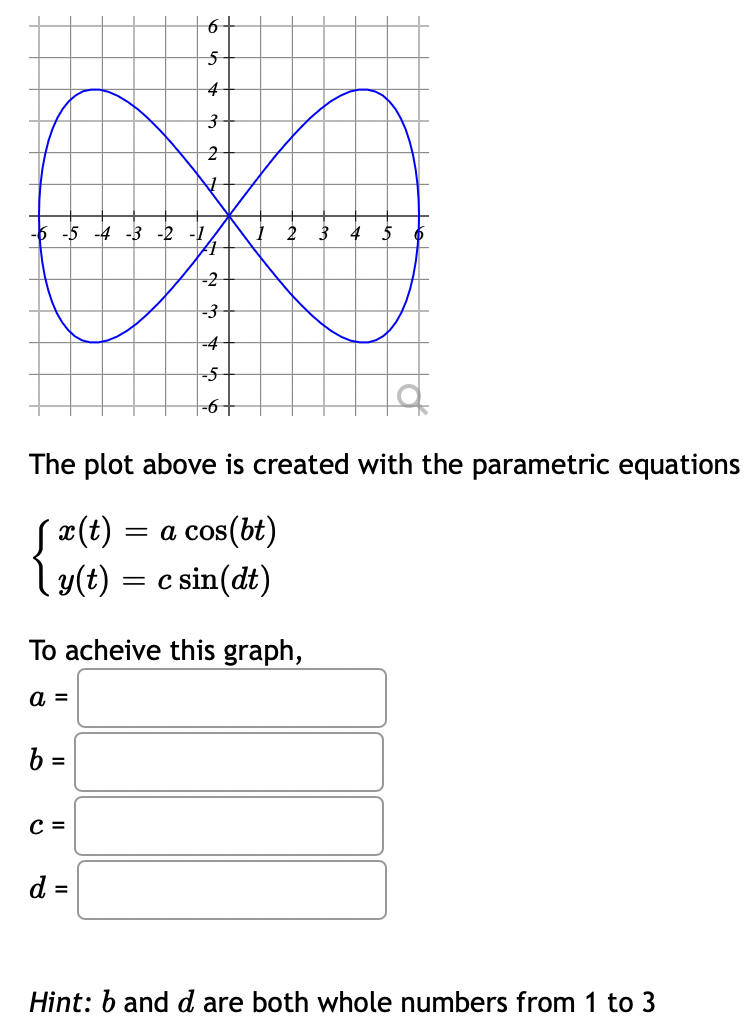
The plot above is created with the parametric equations
( #(t) = a cos(bt)
\y(t)
c sin(dt)
= C
To acheive this graph,
a =
6 =
C =
d =
Hint: b and d are both whole numbers from 1 to 3
Expert Solution
This question has been solved!
Explore an expertly crafted, step-by-step solution for a thorough understanding of key concepts.

This is a popular solution!

Trending now
This is a popular solution!

Step by step
Solved in 2 steps

Recommended textbooks for you
Algebra and Trigonometry (MindTap Course List)
Algebra
ISBN:
9781305071742
Author:
James Stewart, Lothar Redlin, Saleem Watson
Publisher:
Cengage Learning

Algebra & Trigonometry with Analytic Geometry
Algebra
ISBN:
9781133382119
Author:
Swokowski
Publisher:
Cengage
Algebra and Trigonometry (MindTap Course List)
Algebra
ISBN:
9781305071742
Author:
James Stewart, Lothar Redlin, Saleem Watson
Publisher:
Cengage Learning
Algebra & Trigonometry with Analytic Geometry
Algebra
ISBN:
9781133382119
Author:
Swokowski
Publisher:
Cengage