4. A represents the slope of your line of best fit. Pay attention to the number and the unit. Mass Curve: A : 1.378 . RMSE : 4.029 g Take a look at the box below your graph to find the slope of your line. What is the slope of your line?
4. A represents the slope of your line of best fit. Pay attention to the number and the unit. Mass Curve: A : 1.378 . RMSE : 4.029 g Take a look at the box below your graph to find the slope of your line. What is the slope of your line?

Related questions
Question
Pendulum experiment
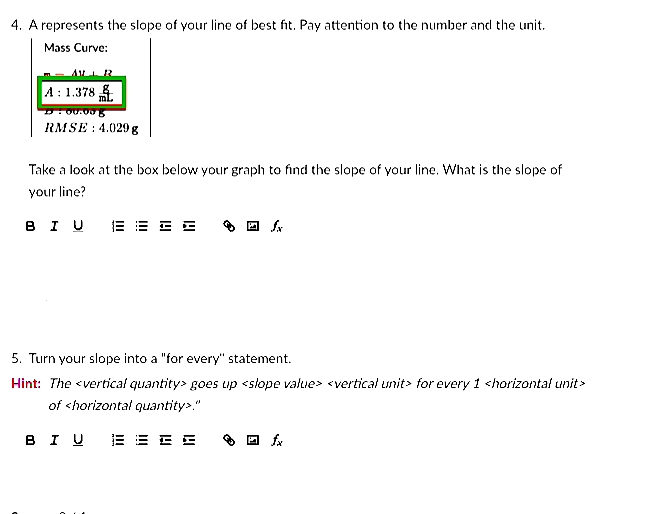
Transcribed Image Text:4. A represents the slope of your line of best fit. Pay attention to the number and the unit.
Mass Curve:
A:1.378 A
RMSE : 4.029 g
Take a look at the box below your graph to find the slope of your line. What is the slope of
your line?
в I U
5. Turn your slope into a "for every" statement.
Hint: The <verticał quantity> goes tup <słope vakue> <vertical unit> for every 1 <horizontał unit>
of <horizontal quantity>."
в I U
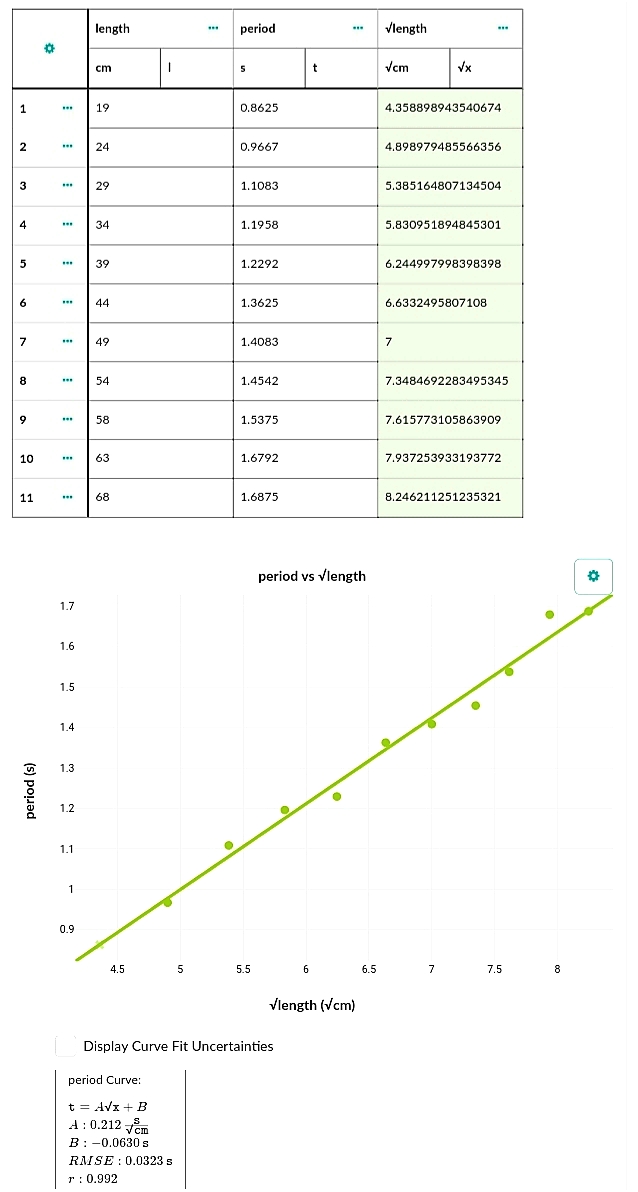
Transcribed Image Text:length
period
Vlength
cm
t
Vcm
Vx
1
19
0.8625
4.358898943540674
...
2
24
0.9667
4.898979485566356
3
29
1.1083
5.385164807134504
4
34
1.1958
5.830951894845301
39
1.2292
6.244997998398398
6
44
1.3625
6.6332495807108
49
1.4083
7
8
54
1.4542
7.3484692283495345
...
9
58
1.5375
7.615773105863909
...
10
63
1.6792
7.937253933193772
11
68
1.6875
8.246211251235321
period vs vlength
1.7
1.6
1.5
1.4
1.3
1.2
1.1
1
0.9
4.5
5
5.5
6
6.5
7
7.5
8.
Viength (Vcm)
Display Curve Fit Uncertainties
period Curve:
t = Avx + B
A : 0.212 Tem
B: -0.0630 s
RMSE : 0.0323 s
r: 0.992
(s) popad
Expert Solution
This question has been solved!
Explore an expertly crafted, step-by-step solution for a thorough understanding of key concepts.

This is a popular solution!

Trending now
This is a popular solution!

Step by step
Solved in 2 steps with 1 images
