
Linear Algebra: A Modern Introduction
4th Edition
ISBN:9781285463247
Author:David Poole
Publisher:David Poole
Chapter7: Distance And Approximation
Section7.5: Applications
Problem 17EQ

Related questions
Question
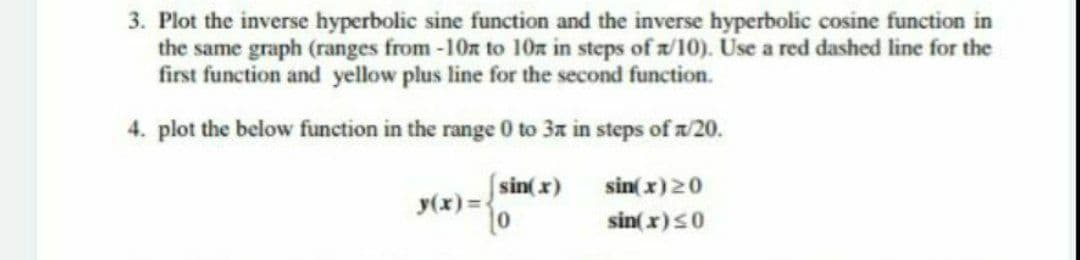
Transcribed Image Text:3. Plot the inverse hyperbolic sine function and the inverse hyperbolic cosine function in
the same graph (ranges from-10z to 10n in steps of z/10). Use a red dashed line for the
first function and yellow plus line for the second function.
4. plot the below function in the range 0 to 3x in steps of z/20.
sin(x)
sin(x)20
y(x)=
sin(x)s0
Expert Solution
This question has been solved!
Explore an expertly crafted, step-by-step solution for a thorough understanding of key concepts.

Step by step
Solved in 2 steps with 1 images

Knowledge Booster


Learn more about
Need a deep-dive on the concept behind this application? Look no further. Learn more about this topic, algebra and related others by exploring similar questions and additional content below.Recommended textbooks for you
Linear Algebra: A Modern Introduction
Algebra
ISBN:
9781285463247
Author:
David Poole
Publisher:
Cengage Learning
Linear Algebra: A Modern Introduction
Algebra
ISBN:
9781285463247
Author:
David Poole
Publisher:
Cengage Learning