4. Results of traffic flow studies on a highway indicate that the flow-density relationship can be described by the expression: q=ujk kj (a) If speed and density observations give the data shown below, develop an appropriate expression for speed versus density for this highway, and solve the expression using linear regression analysis; (b) Determine the density at which the maximum volume will occur as well as the value of the maximum volume. (c) Plot speed versus density for both the expression developed and the data shown, and comment on the differences between the two sets of curves. Speed (mi/h) Density (veh/mi) 50 45 40 34 22 13 12 18 25 41 58
4. Results of traffic flow studies on a highway indicate that the flow-density relationship can be described by the expression: q=ujk kj (a) If speed and density observations give the data shown below, develop an appropriate expression for speed versus density for this highway, and solve the expression using linear regression analysis; (b) Determine the density at which the maximum volume will occur as well as the value of the maximum volume. (c) Plot speed versus density for both the expression developed and the data shown, and comment on the differences between the two sets of curves. Speed (mi/h) Density (veh/mi) 50 45 40 34 22 13 12 18 25 41 58

Traffic and Highway Engineering
5th Edition
ISBN:9781305156241
Author:Garber, Nicholas J.
Publisher:Garber, Nicholas J.
Chapter6: Fundamental Principles Of Traffic Flow
Section: Chapter Questions
Problem 13P

Related questions

Question
Please solve for all transportion Eng
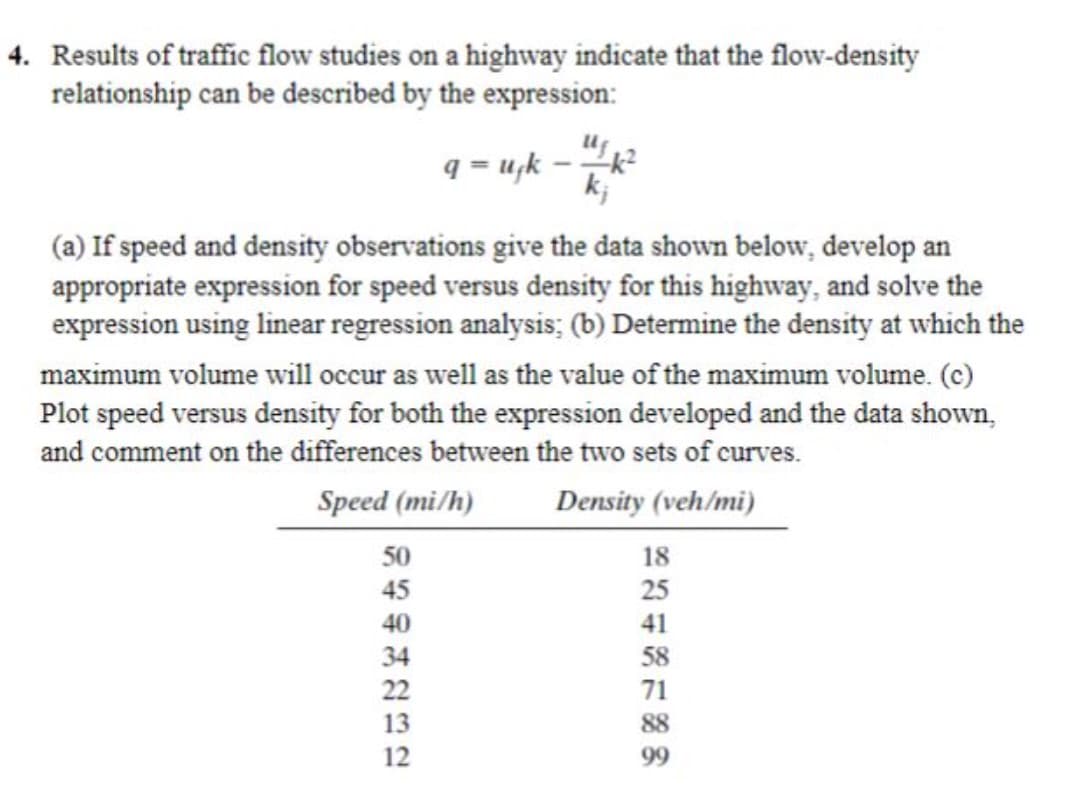
Transcribed Image Text:4. Results of traffic flow studies on a highway indicate that the flow-density
relationship can be described by the expression:
q-uk-k²
kj
(a) If speed and density observations give the data shown below, develop an
appropriate expression for speed versus density for this highway, and solve the
expression using linear regression analysis; (b) Determine the density at which the
maximum volume will occur as well as the value of the maximum volume. (c)
Plot speed versus density for both the expression developed and the data shown,
and comment on the differences between the two sets of curves.
Speed (mi/h)
Density (veh/mi)
50
45
40
34
22
13
12
18
25
41
58
71
88
Expert Solution
Step 1

Trending now
This is a popular solution!

Step by step
Solved in 3 steps with 3 images

Knowledge Booster


Learn more about
Need a deep-dive on the concept behind this application? Look no further. Learn more about this topic, civil-engineering and related others by exploring similar questions and additional content below.Recommended textbooks for you
Traffic and Highway Engineering
Civil Engineering
ISBN:
9781305156241
Author:
Garber, Nicholas J.
Publisher:
Cengage Learning
Traffic and Highway Engineering
Civil Engineering
ISBN:
9781305156241
Author:
Garber, Nicholas J.
Publisher:
Cengage Learning