4. The graph of a function f(x) is given below. 4. In the interval (-00, -3) a) f'(x)>0 and f"(x)>0 b) f'(x)>0 and f"(x)<0 c) f'(x)<0 and f"(x)>0 d) f'(x)<0 and f"(x)<0
4. The graph of a function f(x) is given below. 4. In the interval (-00, -3) a) f'(x)>0 and f"(x)>0 b) f'(x)>0 and f"(x)<0 c) f'(x)<0 and f"(x)>0 d) f'(x)<0 and f"(x)<0

Trigonometry (MindTap Course List)
10th Edition
ISBN:9781337278461
Author:Ron Larson
Publisher:Ron Larson
ChapterP: Prerequisites
SectionP.6: Analyzing Graphs Of Functions
Problem 6ECP: Find the average rates of change of f(x)=x2+2x (a) from x1=3 to x2=2 and (b) from x1=2 to x2=0.

Related questions
Question
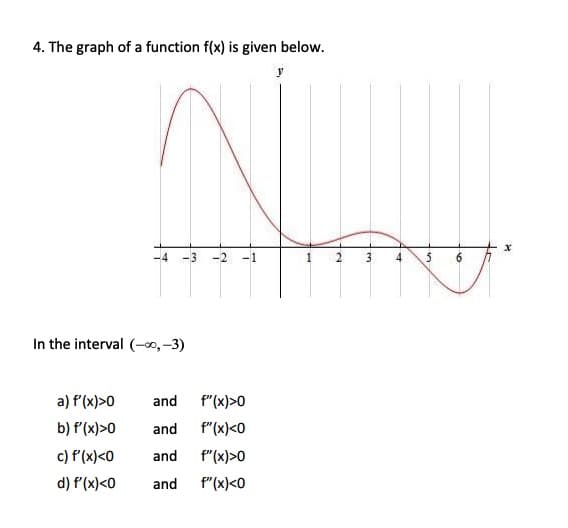
Transcribed Image Text:4. The graph of a function f(x) is given below.
4.
In the interval (-00, -3)
a) f'(x)>0
and
f"(x)>0
b) f'(x)>0
and
f"(x)<0
c) f'(x)<0
and
f"(x)>0
d) f'(x)<0
and
f"(x)<0
Expert Solution
This question has been solved!
Explore an expertly crafted, step-by-step solution for a thorough understanding of key concepts.

This is a popular solution!

Trending now
This is a popular solution!

Step by step
Solved in 2 steps with 2 images

Recommended textbooks for you
Trigonometry (MindTap Course List)
Trigonometry
ISBN:
9781337278461
Author:
Ron Larson
Publisher:
Cengage Learning
Trigonometry (MindTap Course List)
Trigonometry
ISBN:
9781337278461
Author:
Ron Larson
Publisher:
Cengage Learning