42. Match each of the following functions with the graph that best describes the situation. (a) The temperature of a bowl of soup as a function of time (b) The number of hours of daylight per day over a 2-year period (c) The population of Texas as a function of time (d) The distance traveled by a car going at a constant velocity as a function of time (e) The height of a golf ball hit with a 7-iron as a function of time (1) (II) (III) (IV) (V)
42. Match each of the following functions with the graph that best describes the situation. (a) The temperature of a bowl of soup as a function of time (b) The number of hours of daylight per day over a 2-year period (c) The population of Texas as a function of time (d) The distance traveled by a car going at a constant velocity as a function of time (e) The height of a golf ball hit with a 7-iron as a function of time (1) (II) (III) (IV) (V)

College Algebra
7th Edition
ISBN:9781305115545
Author:James Stewart, Lothar Redlin, Saleem Watson
Publisher:James Stewart, Lothar Redlin, Saleem Watson
Chapter2: Functions
Section: Chapter Questions
Problem 30P: In this problem you are asked to find a function that models in real life situation and then use the...

Related questions
Question
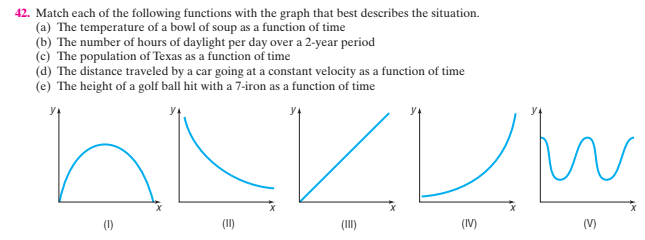
Transcribed Image Text:42. Match each of the following functions with the graph that best describes the situation.
(a) The temperature of a bowl of soup as a function of time
(b) The number of hours of daylight per day over a 2-year period
(c) The population of Texas as a function of time
(d) The distance traveled by a car going at a constant velocity as a function of time
(e) The height of a golf ball hit with a 7-iron as a function of time
(1)
(II)
(III)
(IV)
(V)
Expert Solution
This question has been solved!
Explore an expertly crafted, step-by-step solution for a thorough understanding of key concepts.

This is a popular solution!

Trending now
This is a popular solution!

Step by step
Solved in 2 steps with 2 images

Recommended textbooks for you
College Algebra
Algebra
ISBN:
9781305115545
Author:
James Stewart, Lothar Redlin, Saleem Watson
Publisher:
Cengage Learning

Trigonometry (MindTap Course List)
Trigonometry
ISBN:
9781305652224
Author:
Charles P. McKeague, Mark D. Turner
Publisher:
Cengage Learning

Glencoe Algebra 1, Student Edition, 9780079039897…
Algebra
ISBN:
9780079039897
Author:
Carter
Publisher:
McGraw Hill
College Algebra
Algebra
ISBN:
9781305115545
Author:
James Stewart, Lothar Redlin, Saleem Watson
Publisher:
Cengage Learning
Trigonometry (MindTap Course List)
Trigonometry
ISBN:
9781305652224
Author:
Charles P. McKeague, Mark D. Turner
Publisher:
Cengage Learning
Glencoe Algebra 1, Student Edition, 9780079039897…
Algebra
ISBN:
9780079039897
Author:
Carter
Publisher:
McGraw Hill