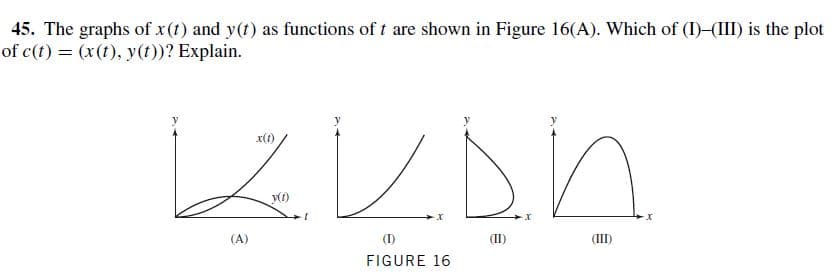
45. The graphs of x(t) and y(t) as functions of t are shown in Figure 16(A). Which of (I)-(III) is the plot of c(t) = (x(t), y(t))? Explain. x(t) УО) (A) (1) (II) (III) FIGURE 16
45. The graphs of x(t) and y(t) as functions of t are shown in Figure 16(A). Which of (I)-(III) is the plot of c(t) = (x(t), y(t))? Explain. x(t) УО) (A) (1) (II) (III) FIGURE 16

Algebra & Trigonometry with Analytic Geometry
13th Edition
ISBN:9781133382119
Author:Swokowski
Publisher:Swokowski
Chapter7: Analytic Trigonometry
Section7.6: The Inverse Trigonometric Functions
Problem 91E

Related questions
Question
Transcribed Image Text:45. The graphs of x(t) and y(t) as functions of t are shown in Figure 16(A). Which of (I)-(III) is the plot
of c(t) = (x(t), y(t))? Explain.
x(t)
УО)
(A)
(1)
(II)
(III)
FIGURE 16
Expert Solution
This question has been solved!
Explore an expertly crafted, step-by-step solution for a thorough understanding of key concepts.

This is a popular solution!

Trending now
This is a popular solution!

Step by step
Solved in 3 steps

Recommended textbooks for you
Algebra & Trigonometry with Analytic Geometry
Algebra
ISBN:
9781133382119
Author:
Swokowski
Publisher:
Cengage
Algebra & Trigonometry with Analytic Geometry
Algebra
ISBN:
9781133382119
Author:
Swokowski
Publisher:
Cengage