47. Review the following inventory graphs, and answer the question that follows. 8000 t Area 7000 6000 5000 4000 3000 2000 1000 0 Inventory Value 8200 8000 7800 7600 7400 7200 7000 6800 6600 6400 Inventory Graph A January 5000 Inventory Graph C January February Inventory Value 7000 8000 February 6000 HH April 8000 March 7000 A. Inventory graph A B. Inventory graph B C. Inventory graph C D. Inventory graph D March 7000 May 7000 June 8000 8000 7000 6000 5000 4000 3000 2000 1000 0 Inventory Value 6000 5000 4000 3000 2000 1000 0 Inventory Value Inventory Graph B January February March 7000 6000 5000 April 4000 Inventory Graph D January February March 5400 5400 5400 April 5400 May 3000 May 5400 June 2000 Which graph represents inventory levels based on an increase in demand of 1.000 pieces per month? June 5400
47. Review the following inventory graphs, and answer the question that follows. 8000 t Area 7000 6000 5000 4000 3000 2000 1000 0 Inventory Value 8200 8000 7800 7600 7400 7200 7000 6800 6600 6400 Inventory Graph A January 5000 Inventory Graph C January February Inventory Value 7000 8000 February 6000 HH April 8000 March 7000 A. Inventory graph A B. Inventory graph B C. Inventory graph C D. Inventory graph D March 7000 May 7000 June 8000 8000 7000 6000 5000 4000 3000 2000 1000 0 Inventory Value 6000 5000 4000 3000 2000 1000 0 Inventory Value Inventory Graph B January February March 7000 6000 5000 April 4000 Inventory Graph D January February March 5400 5400 5400 April 5400 May 3000 May 5400 June 2000 Which graph represents inventory levels based on an increase in demand of 1.000 pieces per month? June 5400

Chapter8: Sequences, Series,and Probability
Section: Chapter Questions
Problem 10CT: Sketch the region corresponding to the system of constraints. Then find the minimum and maximum...

Related questions
Question
Please answer both.
![47. Review the following inventory graphs, and answer the question that follows.
8000
it Area
7000
6000
5000
4000
3000
2000
1000
0
Inventory Value
8200
8000
7800
7600
7400
7200
7000
6800
6600
6400
Inventory Value
Inventory Graph A
January
5000
Inventory Graph C
January February
7000
8000
February
6000
March
7000
A. Inventory graph A
B. Inventory graph B
C. Inventory graph C
D. Inventory graph D
March
7000
[₁]
May
7000
April
8000
June
8000
8000
7000
6000
5000
4000
3000
2000
1000
0
Inventory Value
6000
5000
4000
3000
2000
1000
0
Inventory Value
January
7000
Inventory Graph B
February
6000
March
5000
Inventory Graph D
January February
5400
5400
March
5400
April
4000
April
5400
May
3000
May
5400
June
2000
June
5400
Which graph represents inventory levels based on an increase in demand of 1.000 pieces per
month?](/v2/_next/image?url=https%3A%2F%2Fcontent.bartleby.com%2Fqna-images%2Fquestion%2Ffac7ff20-6b9a-49b5-a542-3111cbc1ac29%2F0e92a95b-0601-4e0c-8110-1c36c76ca247%2Fa3r5nlp_processed.png&w=3840&q=75)
Transcribed Image Text:47. Review the following inventory graphs, and answer the question that follows.
8000
it Area
7000
6000
5000
4000
3000
2000
1000
0
Inventory Value
8200
8000
7800
7600
7400
7200
7000
6800
6600
6400
Inventory Value
Inventory Graph A
January
5000
Inventory Graph C
January February
7000
8000
February
6000
March
7000
A. Inventory graph A
B. Inventory graph B
C. Inventory graph C
D. Inventory graph D
March
7000
[₁]
May
7000
April
8000
June
8000
8000
7000
6000
5000
4000
3000
2000
1000
0
Inventory Value
6000
5000
4000
3000
2000
1000
0
Inventory Value
January
7000
Inventory Graph B
February
6000
March
5000
Inventory Graph D
January February
5400
5400
March
5400
April
4000
April
5400
May
3000
May
5400
June
2000
June
5400
Which graph represents inventory levels based on an increase in demand of 1.000 pieces per
month?
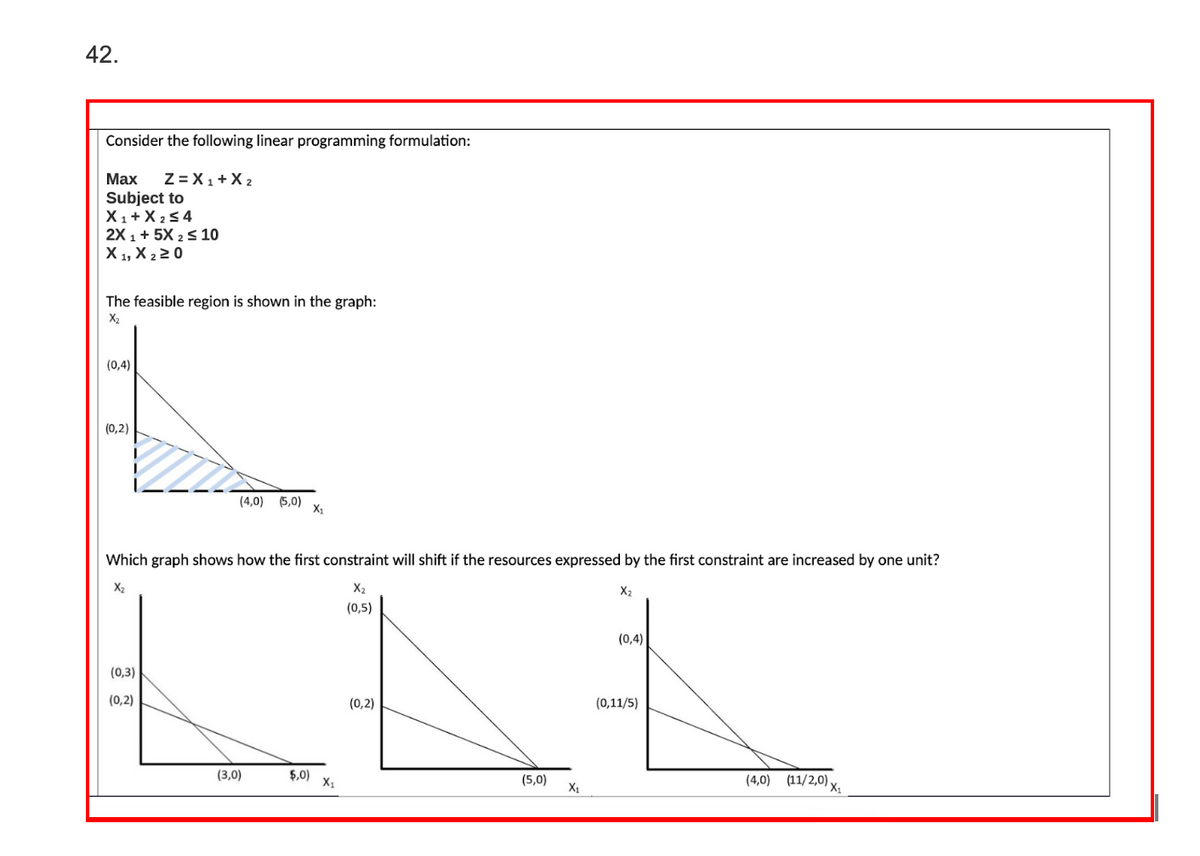
Transcribed Image Text:42.
Consider the following linear programming formulation:
Max Z = X₁ + X₂
Subject to
X₁ + X ₂ ≤4
2X 1 + 5X 2 ≤ 10
X 1, X 2 ≥ 0
The feasible region is shown in the graph:
X₂
(0,4)
(0,2)
(4,0) (5,0)
(0,3)
(0,2)
Which graph shows how the first constraint will shift if the resources expressed by the first constraint are increased by one unit?
X₂
X₂
X₂
(0,5)
(3,0)
X₁
$,0)
X₁
(0,2)
(5,0)
X₁
(0,4)
(0,11/5)
(4,0) (11/2,0) v
X₁
Expert Solution
This question has been solved!
Explore an expertly crafted, step-by-step solution for a thorough understanding of key concepts.

This is a popular solution!

Trending now
This is a popular solution!

Step by step
Solved in 3 steps with 1 images

Recommended textbooks for you

College Algebra
Algebra
ISBN:
9781305115545
Author:
James Stewart, Lothar Redlin, Saleem Watson
Publisher:
Cengage Learning

Algebra: Structure And Method, Book 1
Algebra
ISBN:
9780395977224
Author:
Richard G. Brown, Mary P. Dolciani, Robert H. Sorgenfrey, William L. Cole
Publisher:
McDougal Littell
College Algebra
Algebra
ISBN:
9781305115545
Author:
James Stewart, Lothar Redlin, Saleem Watson
Publisher:
Cengage Learning
Algebra: Structure And Method, Book 1
Algebra
ISBN:
9780395977224
Author:
Richard G. Brown, Mary P. Dolciani, Robert H. Sorgenfrey, William L. Cole
Publisher:
McDougal Littell