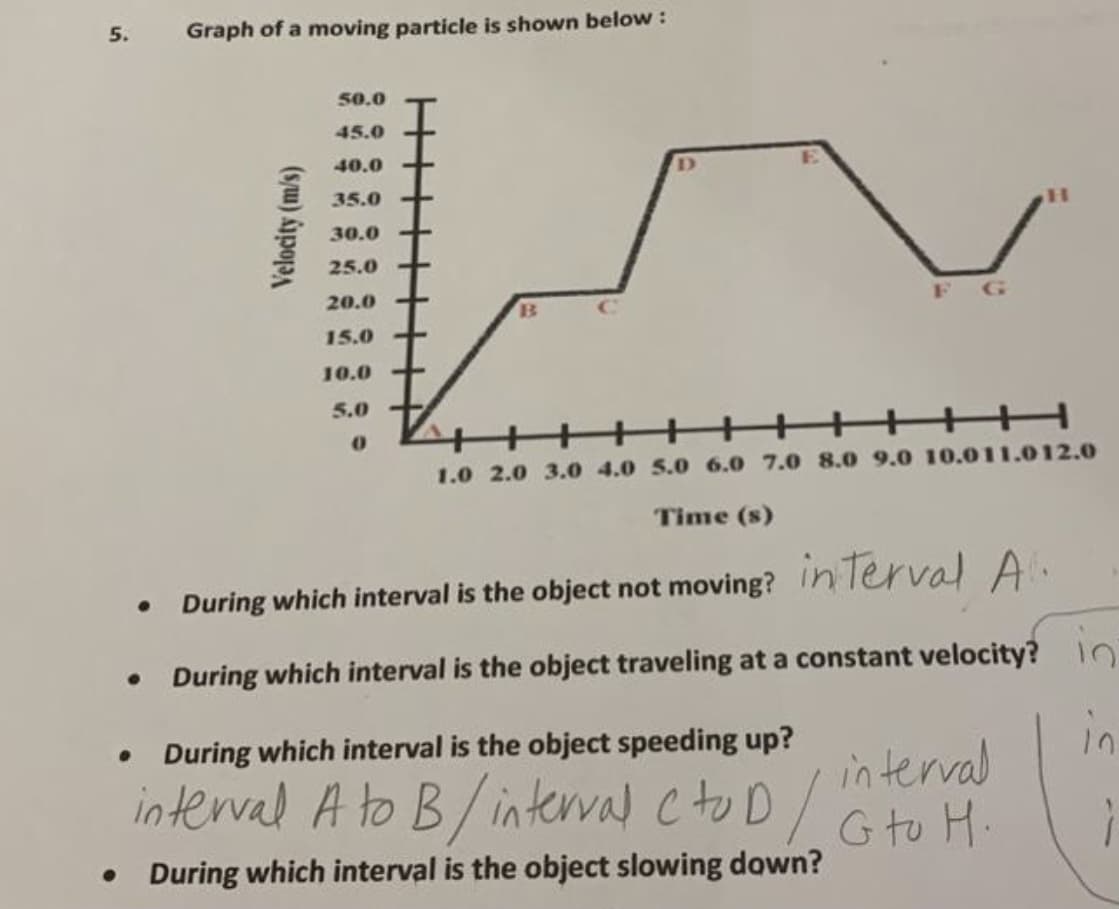
5. Graph of a moving particle is shown below : 50.0 45.0 40.0 E 35.0 - 30.0 25.0 + 20.0 + B 15.0 10.0 + 5.0 +++ +++ +H 1.0 2.0 3.0 4.0 5.0 6.0 7.0 8.0 9.0 10.011.012.0 Time (s) • During which interval is the object not moving? in Terval A. During which interval is the object traveling at a constant velocity? • During which interval is the object speeding up? interval A to B/ interval Cc to D /Gto H. intervral During which interval is the object slowing down?
5. Graph of a moving particle is shown below : 50.0 45.0 40.0 E 35.0 - 30.0 25.0 + 20.0 + B 15.0 10.0 + 5.0 +++ +++ +H 1.0 2.0 3.0 4.0 5.0 6.0 7.0 8.0 9.0 10.011.012.0 Time (s) • During which interval is the object not moving? in Terval A. During which interval is the object traveling at a constant velocity? • During which interval is the object speeding up? interval A to B/ interval Cc to D /Gto H. intervral During which interval is the object slowing down?

Related questions
Question
Answer with short explanation.
Transcribed Image Text:5.
Graph of a moving particle is shown below :
50.0
45.0
40.0
35.0
30.0
25.0 +
20.0 +
F G
B
15.0
10.0
5.0
++++++ +++ H
1.0 2.0 3.0 4.0 5.0 6.0 7.0 8.0 9.0 10.011.012.0
Time (s)
During which interval is the object not moving? Inlerval A.
During which interval is the object traveling at a constant velocity? 10
in
in terval
interval A to B/ interval cto D / G to H.
During which interval is the object speeding up?
• During which interval is the object slowing down?
Expert Solution
This question has been solved!
Explore an expertly crafted, step-by-step solution for a thorough understanding of key concepts.

This is a popular solution!

Trending now
This is a popular solution!

Step by step
Solved in 2 steps
