5. Hopefully your answer to the previous question included the word "slope." A nice way to visualize solutions to differential equations is with a slope field. For any value of t and M, we plug into right-hand side of the differential equation to get the slope, dM/dt, and indicate the slope at that point in the t-M plane by a short line segment as shown in the figure below. In this plot, r =1 and K = 100, and the horizontal axis is t and vertical is M. M 120 100 80 60 40 20 Mlo)=10-> t 6.0 0.0 1.0 2.0 3.0 4.0 5.0
5. Hopefully your answer to the previous question included the word "slope." A nice way to visualize solutions to differential equations is with a slope field. For any value of t and M, we plug into right-hand side of the differential equation to get the slope, dM/dt, and indicate the slope at that point in the t-M plane by a short line segment as shown in the figure below. In this plot, r =1 and K = 100, and the horizontal axis is t and vertical is M. M 120 100 80 60 40 20 Mlo)=10-> t 6.0 0.0 1.0 2.0 3.0 4.0 5.0

Calculus: Early Transcendentals
8th Edition
ISBN:9781285741550
Author:James Stewart
Publisher:James Stewart
Chapter1: Functions And Models
Section: Chapter Questions
Problem 1RCC: (a) What is a function? What are its domain and range? (b) What is the graph of a function? (c) How...

Related questions
Question
What is the long term behavior of your hand drawn solution; that is, what is lim t-> infinity M(t) equal to?
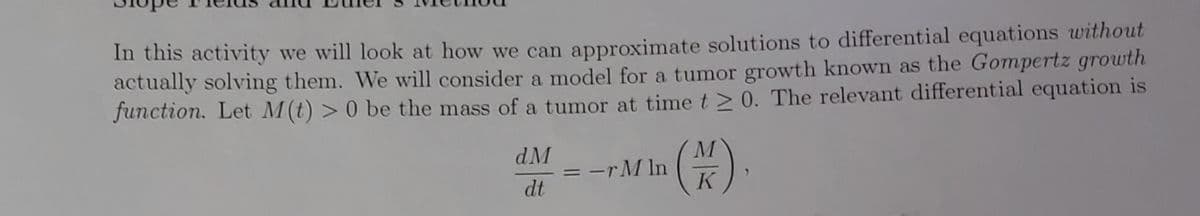
Transcribed Image Text:In this activity we will look at how we can approximate solutions to differential equations without
actually solving them. We will consider a model for a tumor growth known as the Gompertz growth
function. Let M(t) > 0 be the mass of a tumor at timet2 0. The relevant differential equation is
dM
-rM In
K
dt
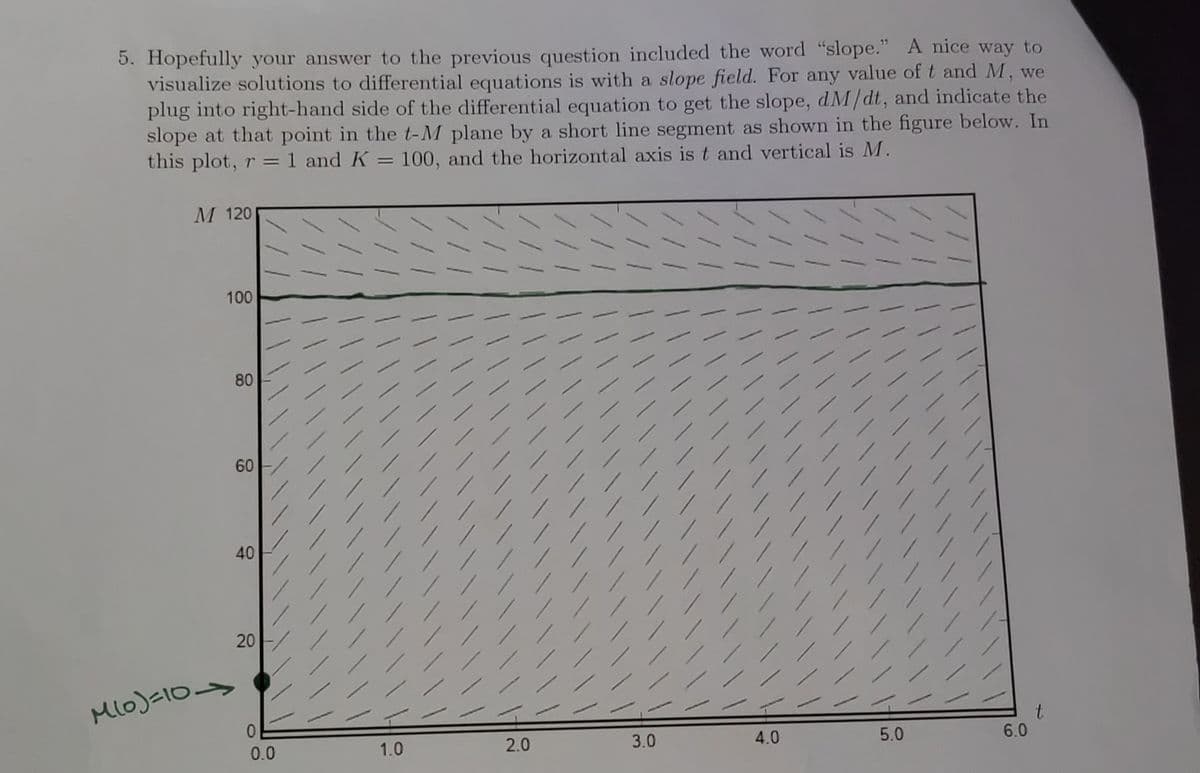
Transcribed Image Text:5. Hopefully your answer to the previous question included the word "slope." A nice way to
visualize solutions to differential equations is with a slope field. For any value of t and M, we
plug into right-hand side of the differential equation to get the slope, dM/dt, and indicate the
slope at that point in the t-M plane by a short line segment as shown in the figure below. In
this plot, r =1 and K = 100, and the horizontal axis is t and vertical is M.
M 120
100
80
60
40
MlO)=10->
0.0
1.0
2.0
3.0
4.0
5.0
6.0
ノ///ニ
20
Expert Solution
This question has been solved!
Explore an expertly crafted, step-by-step solution for a thorough understanding of key concepts.

Step by step
Solved in 3 steps with 2 images

Recommended textbooks for you
Calculus: Early Transcendentals
Calculus
ISBN:
9781285741550
Author:
James Stewart
Publisher:
Cengage Learning

Thomas' Calculus (14th Edition)
Calculus
ISBN:
9780134438986
Author:
Joel R. Hass, Christopher E. Heil, Maurice D. Weir
Publisher:
PEARSON

Calculus: Early Transcendentals (3rd Edition)
Calculus
ISBN:
9780134763644
Author:
William L. Briggs, Lyle Cochran, Bernard Gillett, Eric Schulz
Publisher:
PEARSON
Calculus: Early Transcendentals
Calculus
ISBN:
9781285741550
Author:
James Stewart
Publisher:
Cengage Learning
Thomas' Calculus (14th Edition)
Calculus
ISBN:
9780134438986
Author:
Joel R. Hass, Christopher E. Heil, Maurice D. Weir
Publisher:
PEARSON
Calculus: Early Transcendentals (3rd Edition)
Calculus
ISBN:
9780134763644
Author:
William L. Briggs, Lyle Cochran, Bernard Gillett, Eric Schulz
Publisher:
PEARSON

Calculus: Early Transcendentals
Calculus
ISBN:
9781319050740
Author:
Jon Rogawski, Colin Adams, Robert Franzosa
Publisher:
W. H. Freeman


Calculus: Early Transcendental Functions
Calculus
ISBN:
9781337552516
Author:
Ron Larson, Bruce H. Edwards
Publisher:
Cengage Learning