5. Repeat the process for r = 4, but let x0 = 0.201. How does this behavior compare with the behavior for x0 = 0.2?
5. Repeat the process for r = 4, but let x0 = 0.201. How does this behavior compare with the behavior for x0 = 0.2?

Algebra & Trigonometry with Analytic Geometry
13th Edition
ISBN:9781133382119
Author:Swokowski
Publisher:Swokowski
Chapter5: Inverse, Exponential, And Logarithmic Functions
Section5.6: Exponential And Logarithmic Equations
Problem 64E

Related questions

Concept explainers
Equations and Inequations
Equations and inequalities describe the relationship between two mathematical expressions.
Linear Functions
A linear function can just be a constant, or it can be the constant multiplied with the variable like x or y. If the variables are of the form, x2, x1/2 or y2 it is not linear. The exponent over the variables should always be 1.
Question
5. Repeat the process for r = 4, but let x0 = 0.201. How does this behavior compare with the behavior for x0 = 0.2?
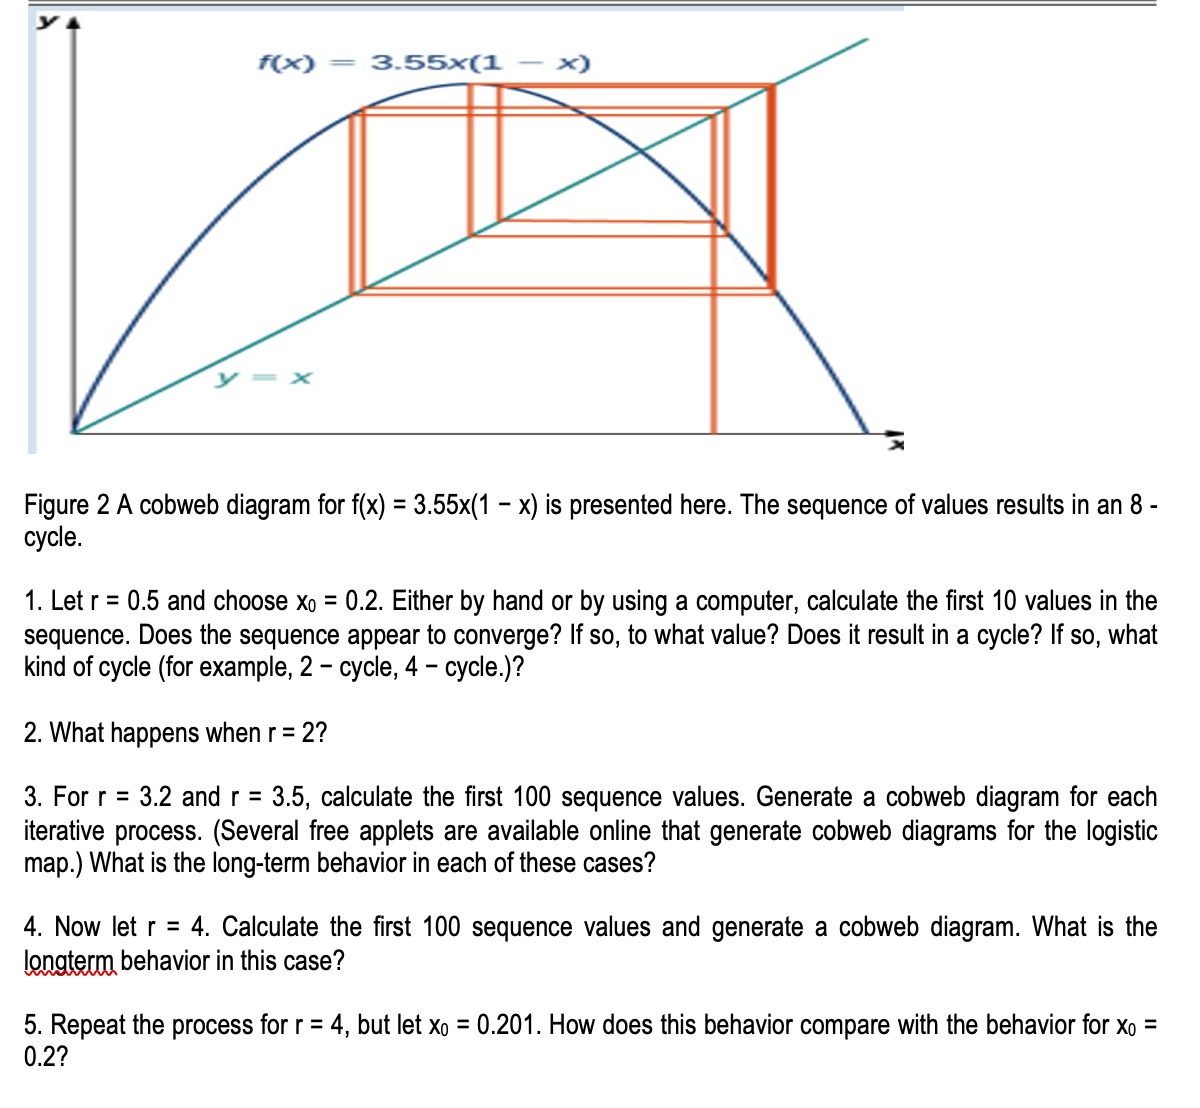
Transcribed Image Text:f(x)
3.55x(1
x)
Figure 2 A cobweb diagram for f(x) = 3.55x(1 – x) is presented here. The sequence of values results in an 8 -
cycle.
1. Let r = 0.5 and choose xo = 0.2. Either by hand or by using a computer, calculate the first 10 values in the
sequence. Does the sequence appear to converge? If so, to what value? Does it result in a cycle? If so, what
kind of cycle (for example, 2 - cycle, 4 -
- cycle.)?
2. What happens when r = 2?
3. For r = 3.2 and r =
3.5, calculate the first 100 sequence values. Generate a cobweb diagram for each
iterative process. (Several free applets are available online that generate cobweb diagrams for the logistic
map.) What is the long-term behavior in each of these cases?
4. Now let r = 4. Calculate the first 100 sequence values and generate a cobweb diagram. What is the
longterm behavior in this case?
5. Repeat the process for r = 4, but let xo = 0.201. How does this behavior compare with the behavior for xo =
0.2?
Expert Solution
This question has been solved!
Explore an expertly crafted, step-by-step solution for a thorough understanding of key concepts.

Step by step
Solved in 3 steps with 1 images

Knowledge Booster


Learn more about
Need a deep-dive on the concept behind this application? Look no further. Learn more about this topic, advanced-math and related others by exploring similar questions and additional content below.Recommended textbooks for you
Algebra & Trigonometry with Analytic Geometry
Algebra
ISBN:
9781133382119
Author:
Swokowski
Publisher:
Cengage
Algebra & Trigonometry with Analytic Geometry
Algebra
ISBN:
9781133382119
Author:
Swokowski
Publisher:
Cengage