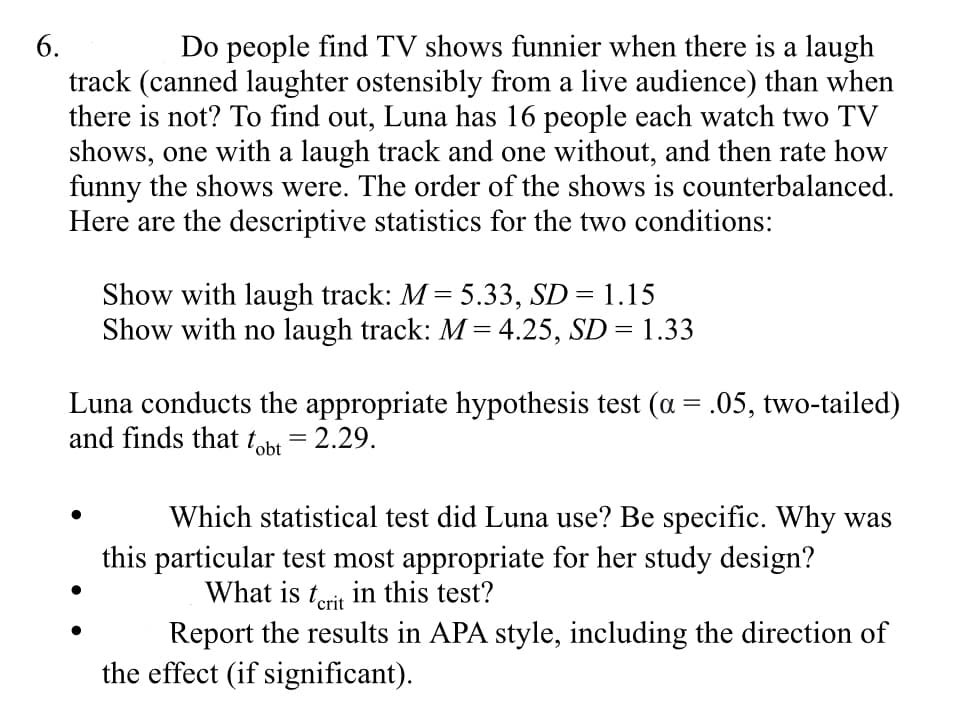
6. Do people find TV shows funnier when there is a laugh track (canned laughter ostensibly from a live audience) than when there is not? To find out, Luna has 16 people each watch two TV shows, one with a laugh track and one without, and then rate how funny the shows were. The order of the shows is counterbalanced. Here are the descriptive statistics for the two conditions: Show with laugh track: M = 5.33, SD = 1.15 Show with no laugh track: M = 4.25, SD = 1.33 Luna conducts the appropriate hypothesis test (a = .05, two-tailed) and finds that tobt = 2.29. Which statistical test did Luna use? Be specific. Why was this particular test most appropriate for her study design? What is terit in this test? Report the results in APA style, including the direction of the effect (if significant).
6. Do people find TV shows funnier when there is a laugh track (canned laughter ostensibly from a live audience) than when there is not? To find out, Luna has 16 people each watch two TV shows, one with a laugh track and one without, and then rate how funny the shows were. The order of the shows is counterbalanced. Here are the descriptive statistics for the two conditions: Show with laugh track: M = 5.33, SD = 1.15 Show with no laugh track: M = 4.25, SD = 1.33 Luna conducts the appropriate hypothesis test (a = .05, two-tailed) and finds that tobt = 2.29. Which statistical test did Luna use? Be specific. Why was this particular test most appropriate for her study design? What is terit in this test? Report the results in APA style, including the direction of the effect (if significant).

Glencoe Algebra 1, Student Edition, 9780079039897, 0079039898, 2018
18th Edition
ISBN:9780079039897
Author:Carter
Publisher:Carter
Chapter10: Statistics
Section10.6: Summarizing Categorical Data
Problem 27PPS

Related questions
Question
Transcribed Image Text:6.
Do people find TV shows funnier when there is a laugh
track (canned laughter ostensibly from a live audience) than when
there is not? To find out, Luna has 16 people each watch two TV
shows, one with a laugh track and one without, and then rate how
funny the shows were. The order of the shows is counterbalanced.
Here are the descriptive statistics for the two conditions:
Show with laugh track: M = 5.33, SD = 1.15
Show with no laugh track: M = 4.25, SD = 1.33
Luna conducts the appropriate hypothesis test (a = .05, two-tailed)
and finds that tobt
= 2.29.
Which statistical test did Luna use? Be specific. Why was
this particular test most appropriate for her study design?
What is terit in this test?
Report the results in APA style, including the direction of
the effect (if significant).
Expert Solution
This question has been solved!
Explore an expertly crafted, step-by-step solution for a thorough understanding of key concepts.

Step by step
Solved in 2 steps with 1 images

Recommended textbooks for you
Glencoe Algebra 1, Student Edition, 9780079039897…
Algebra
ISBN:
9780079039897
Author:
Carter
Publisher:
McGraw Hill

Glencoe Algebra 1, Student Edition, 9780079039897…
Algebra
ISBN:
9780079039897
Author:
Carter
Publisher:
McGraw Hill