6. Robin fills a bathtub and then drains it. Use the following information to draw a graph of the water level in the bathtub over time. The water level starts at 0 cm. After Robin turns on the taps, the water level rises at a rate of 0.11 cm/s for 60 s. Robin turns off the tap after about 60 s. The water level is constant for another 60 s. Then Robin pulls the plug, and the water level drops at a rate of 0.29 cm/s until the tub is empty.
6. Robin fills a bathtub and then drains it. Use the following information to draw a graph of the water level in the bathtub over time. The water level starts at 0 cm. After Robin turns on the taps, the water level rises at a rate of 0.11 cm/s for 60 s. Robin turns off the tap after about 60 s. The water level is constant for another 60 s. Then Robin pulls the plug, and the water level drops at a rate of 0.29 cm/s until the tub is empty.

Chapter3: Functions
Section3.3: Rates Of Change And Behavior Of Graphs
Problem 45SE: A driver of a car stopped at a gas station to fill up his gas tank. He looked at his watch, and the...

Related questions
Question
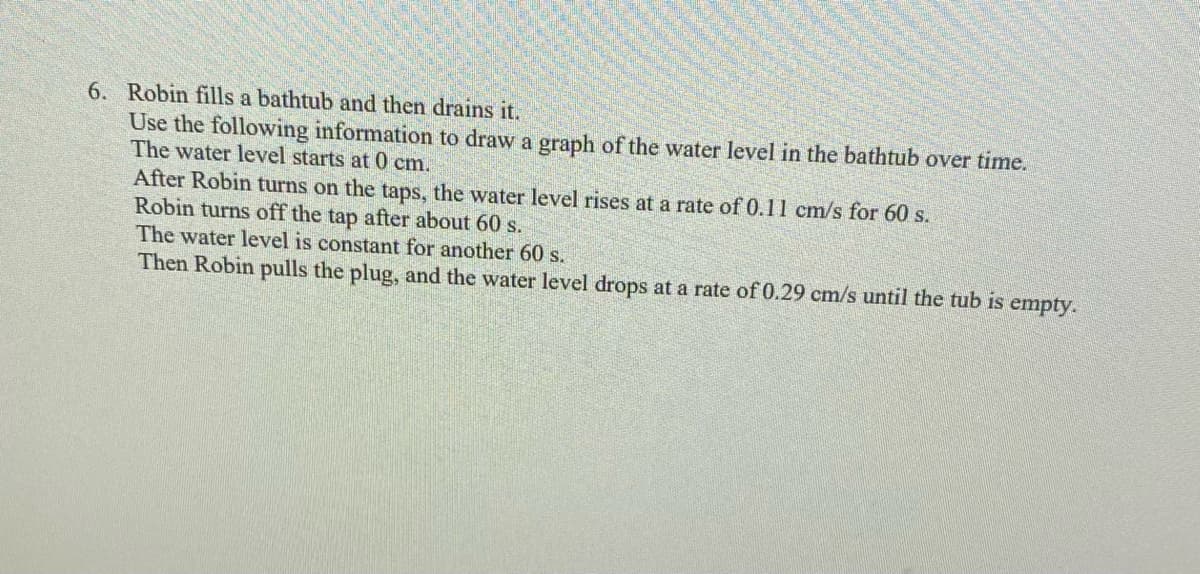
Transcribed Image Text:6. Robin fills a bathtub and then drains it.
Use the following information to draw a graph of the water level in the bathtub over time.
The water level starts at 0 cm.
After Robin turns on the taps, the water level rises at a rate of 0.11 cm/s for 60 s.
Robin turns off the tap after about 60 s.
The water level is constant for another 60 s.
Then Robin pulls the plug, and the water level drops at a rate of 0.29 cm/s until the tub is empty.
Expert Solution
This question has been solved!
Explore an expertly crafted, step-by-step solution for a thorough understanding of key concepts.

Step by step
Solved in 2 steps with 2 images

Recommended textbooks for you

Algebra & Trigonometry with Analytic Geometry
Algebra
ISBN:
9781133382119
Author:
Swokowski
Publisher:
Cengage

Algebra & Trigonometry with Analytic Geometry
Algebra
ISBN:
9781133382119
Author:
Swokowski
Publisher:
Cengage

Big Ideas Math A Bridge To Success Algebra 1: Stu…
Algebra
ISBN:
9781680331141
Author:
HOUGHTON MIFFLIN HARCOURT
Publisher:
Houghton Mifflin Harcourt

Functions and Change: A Modeling Approach to Coll…
Algebra
ISBN:
9781337111348
Author:
Bruce Crauder, Benny Evans, Alan Noell
Publisher:
Cengage Learning
