6.7 To measure g (the acceleration due to gravity), the following experi- ment is carried out. A ball is dropped from the top of a 100-m-tall building. As the object is falling down, the time t when it passes sensors mounted on the building wall is recorded. The data measured in the experiment is given in the table. 100 80 20 0 h (m) t (s) 60 40 2.02 2.86 3.50 4.04 0 4.51 In terms of the coordinates shown in the figure, the position of the ball h as a function of the time t is given by h = h₁-1½gt², where h。 = 100 m is the initial position of the ball. Use linear regression to best fit the equation to the data and determine the experimental value of g. 田田田田田田 田田田田田田 A
6.7 To measure g (the acceleration due to gravity), the following experi- ment is carried out. A ball is dropped from the top of a 100-m-tall building. As the object is falling down, the time t when it passes sensors mounted on the building wall is recorded. The data measured in the experiment is given in the table. 100 80 20 0 h (m) t (s) 60 40 2.02 2.86 3.50 4.04 0 4.51 In terms of the coordinates shown in the figure, the position of the ball h as a function of the time t is given by h = h₁-1½gt², where h。 = 100 m is the initial position of the ball. Use linear regression to best fit the equation to the data and determine the experimental value of g. 田田田田田田 田田田田田田 A

Algebra & Trigonometry with Analytic Geometry
13th Edition
ISBN:9781133382119
Author:Swokowski
Publisher:Swokowski
Chapter5: Inverse, Exponential, And Logarithmic Functions
Section5.6: Exponential And Logarithmic Equations
Problem 54E

Related questions
Question
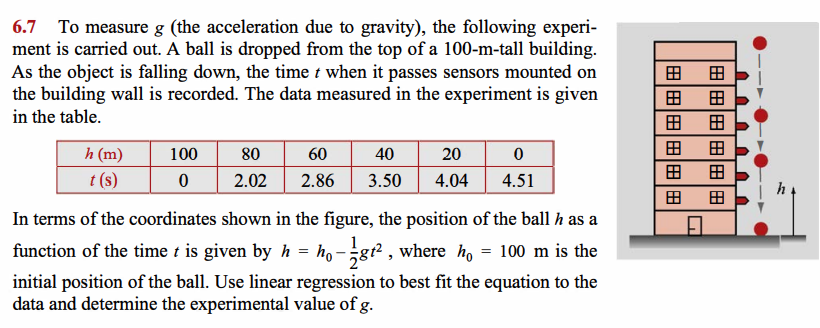
Transcribed Image Text:6.7 To measure g (the acceleration due to gravity), the following experi-
ment is carried out. A ball is dropped from the top of a 100-m-tall building.
As the object is falling down, the time t when it passes sensors mounted on
the building wall is recorded. The data measured in the experiment is given
in the table.
100
80
60
40
20
0
h (m)
t(s)
0
2.02 2.86
3.50
4.04
4.51
In terms of the coordinates shown in the figure, the position of the ball h as a
function of the time t is given by h = ho- 12gt², where ho = 100 m is the
initial position of the ball. Use linear regression to best fit the equation to the
data and determine the experimental value of g.
田田田田田田
田田田田田田
A
Expert Solution
This question has been solved!
Explore an expertly crafted, step-by-step solution for a thorough understanding of key concepts.

This is a popular solution!

Trending now
This is a popular solution!

Step by step
Solved in 5 steps

Recommended textbooks for you
Algebra & Trigonometry with Analytic Geometry
Algebra
ISBN:
9781133382119
Author:
Swokowski
Publisher:
Cengage
Algebra & Trigonometry with Analytic Geometry
Algebra
ISBN:
9781133382119
Author:
Swokowski
Publisher:
Cengage