60.00 10 15 20 20.00 25 30 35 35.00 40 - 45 50 10 20 30 40 50 60 70 80 90 100 Receiver Offset, (m) Depth, (m)

Q: 5. (a) Explain the advantages of the Newton Raphson method over the Gauss and Gauss-Seidel iterative...
A: There are 2 different questions. As per our policy, we will answer the first one.
Q: Consider the network of resistors in the figure. If R = 12.0 Ω, calculate the equivalent resistance ...
A:
Q: You are a project manager for a manufacturing company. One of the machine parts on the assembly line...
A: Given, Mass of rod m =0.900 KgLength of rod l =60.0 cm
Q: Show that the two successive Lorentz transformations corresponding to speeds v, and vz are equivalen...
A: Solution: The first Lorentz transformation for space is given as Where and the frame is travelling...
Q: A solar dish-engine system has single cylinder Stirling engine mounted on the focus of the solar dis...
A:
Q: Please solve . Don't reject please
A: The equation of this damped spring is given as: d2xdt2+μmdxdt+kmx =0solving this double differential...
Q: Q8: X-ray radiation is incident in the cubic crystal lattice plan (242), if the distance between two...
A: Bragg's Law When highly energetic radiation is incident on a crystal, the radiation gets diffracted....
Q: A star in the Milky Way that is about 60 percent of the way out from the center of the galaxy has an...
A: Answer: Detail solution in below.
Q: Calculate the magnetic flux density at the following points: At a distance of 0.65 m from a long str...
A:
Q: A helium nucleus has a mass of 4.001505 u. What is its binding energy?
A: The binding energy is given by the following expression: Eb=2mp+2mn-mHec2 Substitute the necessary v...
Q: A 1 m long electrically conductive wire made of material X has electrical conductivity of 0.2x10⁷(oh...
A: Solution: As per the given data, We know that, Electrical resistivity is given as: ρ=RAl ...
Q: How much energy is transmitted to a cell during a day's treatment? Assume that the specific gravity ...
A: Given: The specific heat of tumor is ρt=1ρw. The specific heat of tumor is calculated as, ρt=1103 ...
Q: The total load of a properly loaded bar of 20 cm length is 40 uCWhat is its magnitude and direction ...
A: Given q=40μC=40x10-6C L=20cm=0.2m d=36cm=0.36m
Q: A resistor (R = 9.00 x 10² Q), a capacitor (C = 0.250 µF), and an inductor (L = 1.60 H) are connecte...
A: Given, R=900ohmC=0.250micro faradL=1.60Henaryf=240Hzvmax=150Volt
Q: A man of mass 65 kg stands on a solid floating on water. If the solid has a density of 0.6 g/cm3 and...
A: Given data mm=65 kgρs=600 kg/m3
Q: 7: An emf is induced by rotating a 1070 turn, 20.0 cm diameter coil in the Earth's 5.25 ✕ 10−5 T mag...
A:
Q: A standing-wave pattern is set up by radio waves between two metal sheets 2.80 m apart, which is the...
A: In standing wave pattern two identical waves are formed in opposite directions.
Q: Figure P.4.8 shows what’s called a corner mirror. Determine the direction of the exiting ray with re...
A:
Q: A ball is thrown upward from the top of a building at an angle of 30 degrees above the horizontal an...
A: Given, Angle,θ=300Initial Speed,u=20m/sAcceleration due to gravity,g=9.8m/s2Height,h=45m Initial vel...
Q: The mechanics at Lincoln Automotive are reboring a 6-in. deep cylinder to fit a new piston. The mach...
A:
Q: Complete the following quantum analogy: an electron is to electricity, as a _____ is to light.
A: Given: Complete the following quantum analogy: an electron is to electricity, as a _____ is to light...
Q: Figure (a) shows a length of wire carrying a current i and bent into a circular coil of one turn. In...
A:
Q: A railroad flatcar is traveling to the right at a speed of 13.0 m/srelative to an observer standing ...
A: Given: A railroad flatcar is traveling to the right at a speed of 13.0 m/s relative to an observer...
Q: A cylindrical copper cable 1.50 km long is connected acrossa 220.0 V potential difference. What shou...
A: l=1.50 km V=220 V R=V2P=220290=537.77 Ω R=ρLAA=1.72×10-8×1500537.77=4.79×10⁻⁸ m2A=πD24D=4Aπ=2.47×10-...
Q: Draw band diagrams for below contacts. a) metal-n-type semiconductor for Φm< Φs b) metal-n-type s...
A: please see the next step for solution
Q: Create a timeline using illustrations and text showing on how elements form with the concept of atom...
A: A timeline of atomic models Atomic model (1808) Plum-pudding model (1904) Nuclear model (1911) Plane...
Q: When a 220 Volt potential difference is applied to a heater with a resistance of 20 Ω;a) The power o...
A: Given, V=220 voltR=20 Ω
Q: Comment on the following statement: When two gases are mixed, if they are to be in thermal equilibri...
A: Given: To explain the gas which is mixed are in thermal equilibrium as,
Q: i) Explain the Hexagonal Closed Packing (HCP) unit cell with a neat diagram and provide a minimum of...
A:
Q: A circular tablet with a radius of 20 cm and a uniform luminosity of 10.5 cd / m ^ 2 illuminates a s...
A: To solve this lets consider the surface to be a circular disc, of surface area ∆A2 with a light sour...
Q: A rocket flying at a speed of 0.50c in relation to the ground. Jenny's heart rate is 75 beats per mi...
A: Given: Speed of rocket is 0.50c in relation to ground. Heart rate of Jenny is 75beats per minute.
Q: Prove that (x) = 0 for the ground state of a harmonic oscillator. b) Prove that (2²) 2 uk for the gr...
A: Note :- We’ll answer the first question since the exact one wasn’t specified. Please submit a new qu...
Q: 2. Barium-133 is a radioactive element used in certain medical procedures. A sample of pure Barium- ...
A: we know the Half life of Ba-133 T1/2 = 10.51 y So the decay constant is given by λ = 0.693T1/2 = ...
Q: The 50-kg pipe is supported at A by a system of five cords. Determine the force in the cable AB for ...
A:
Q: 3-
A: Given : Current I = 7.70A Electric field, B = 1.20 T Length of the wire =L = 50.0 cm magnetic f...
Q: Two horizontal metal plates, each 100 mm square, are spaced 10.0 mm apart and stacked on top of one ...
A: Given: Area of each plate is 100mm2. Separation between the plates is 10.0mm. Electric field is 2000...
Q: A 6.00 m uniform beam of mass 17.0 kg is hinged to a vertical wall. The beam is kept in a stationary...
A: Apply Newton's law and moment's equation at hinge,
Q: Directions: Complete the electron configuration of the following element and get the quantum numbers...
A:
Q: A current is flowing along a straight wire in the direction shown. There is a uniform magnetic field...
A: the force on a current carrying wire in magnetic field is given by, F=IL×B Cross product means that ...
Q: Determine the minimum height of a vertical flat mirror in which a person 181 cm tall can see his or ...
A: Given: height of a person= 181cm
Q: 8.2-3 Parameters of a Dielectric Waveguide. Light of free-space wavelength d, = 0.87 um is guided by...
A:
Q: An architecture student working at a drafting table requires some muscle action in order to support ...
A: Solution: As per the given data,
Q: A neutral pion moving with velocity v decays into two photons; one photon of energy E1 travellmg m t...
A: As there is no external force is applied momentum is conserved. Momentum of pion = momentum of one p...
Q: A uniform plastic block floats in water with 30.0% of its volume above the surface of the water. The...
A: Given: Volume displaced by plastic block in water is Vw=30%=0.30m3 Volume displaced by plastic block...
Q: Coherent light that contains two wavelengths, 660 nm (red) and 470 nm (blue), passes through two nar...
A: Given, Wavelength of red light, λ1=660 nm Wavelength of blue light, λ2=470 nm Distance between the t...
Q: Advanced Physics Question
A: Capacitance C=Aε0d So Capacitance is directly proportional to area and permittivity constant of the ...
Q: Bn Review Early in the morning, when the temperature is 5.0 °C, gasoline is pumped into a car's 51-L...
A:
Q: Find the expectation value of the radial position for the electron of the hydrogen atom in the 2s an...
A: Requirements: The radial function of the 2s state of the electron in the hydrogen atom The radial f...
Q: What is the radius of a tightly wound solenoid of circular cross-section that has 170 turns if chang...
A: Given, N=170 Turns dBdt=4.0 Tesla per secondI= 7.0AmpereR= 15Ω
Q: The sun emits light (which we can regard as a sinusoidalwave) equally in all directions. The distanc...
A: Let I denotes the light intensity, c denotes the light speed, E0 denotes the electric field amplitud...
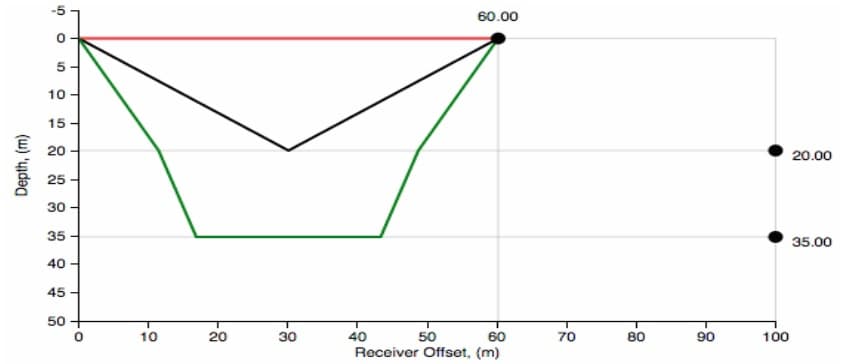
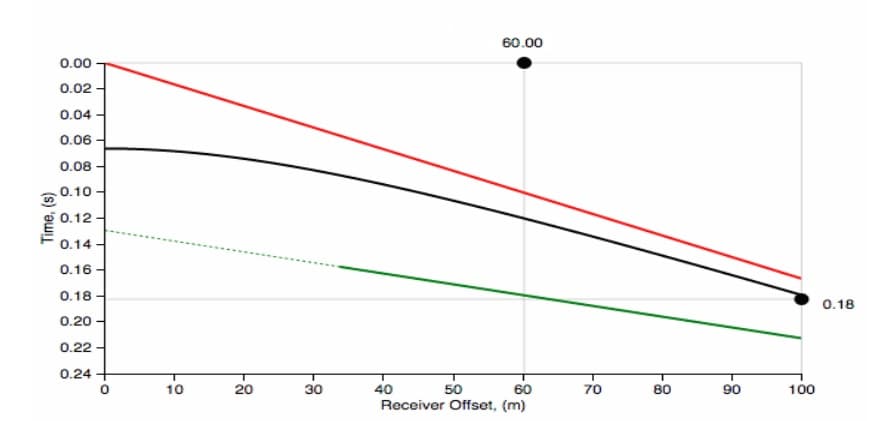
The plot below shows ray paths and arrival times for P-wave seismic signals
recorded at a geophone located 60m from a source.
a. Using the plots below, what can you deduce about the relationship
between the velocities of each of the layers?
b. Imagine you can extend the spread of geophone to some large offset. From your answer above, would you expect to see the refracted wave along
layers as first arrival?

Step by step
Solved in 2 steps
