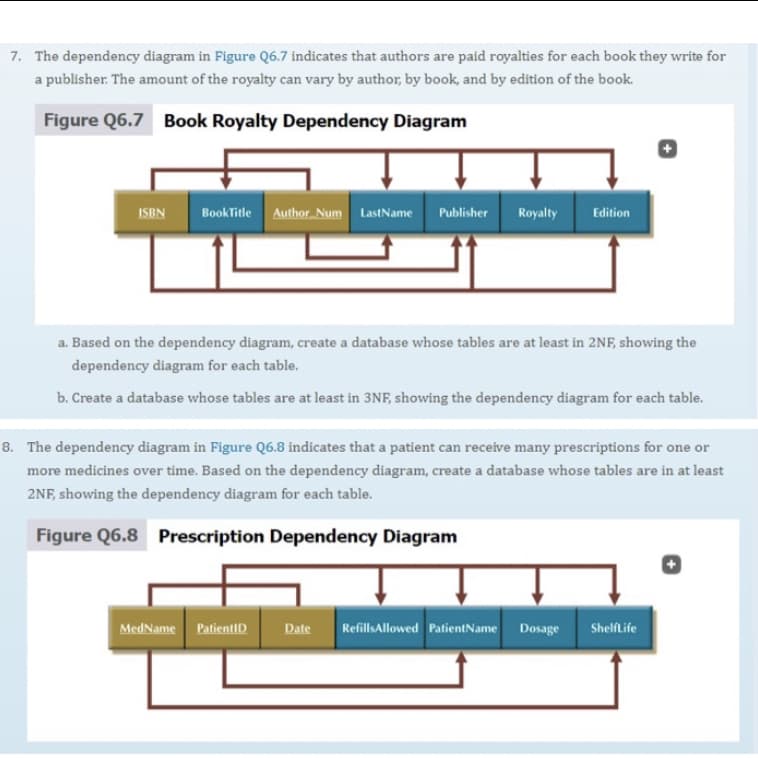
7. The dependency diagram in Figure Q6.7 indicates that authors are paid royalties for each book they write for a publisher. The amount of the royalty can vary by author, by book, and by edition of the book. Figure Q6.7 Book Royalty Dependency Diagram ISBN BookTitle Author. Num LastName Publisher Royalty Edition a. Based on the dependency diagram, create a database whose tables are at least in 2NF, showing the dependency diagram for each table. b. Create a database whose tables are at least in 3NF, showing the dependency diagram for each table.
7. The dependency diagram in Figure Q6.7 indicates that authors are paid royalties for each book they write for a publisher. The amount of the royalty can vary by author, by book, and by edition of the book. Figure Q6.7 Book Royalty Dependency Diagram ISBN BookTitle Author. Num LastName Publisher Royalty Edition a. Based on the dependency diagram, create a database whose tables are at least in 2NF, showing the dependency diagram for each table. b. Create a database whose tables are at least in 3NF, showing the dependency diagram for each table.

Database Systems: Design, Implementation, & Management
11th Edition
ISBN:9781285196145
Author:Steven, Steven Morris, Carlos Coronel, Carlos, Coronel, Carlos; Morris, Carlos Coronel and Steven Morris, Carlos Coronel; Steven Morris, Steven Morris; Carlos Coronel
Publisher:Steven, Steven Morris, Carlos Coronel, Carlos, Coronel, Carlos; Morris, Carlos Coronel and Steven Morris, Carlos Coronel; Steven Morris, Steven Morris; Carlos Coronel
Chapter10: Transaction Management And Concurrency Control
Section: Chapter Questions
Problem 1P

Related questions
Question
Can someone create this in a ERD for number 7 it’s a 2NF AND Number 8 is 3NF - I have the solution I just need to entities and cardinalities
Transcribed Image Text:7. The dependency diagram in Figure Q6.7 indicates that authors are paid royalties for each book they write for
a publisher. The amount of the royalty can vary by author, by book, and by edition of the book.
Figure Q6.7 Book Royalty Dependency Diagram
BookTitle Author Num LastName Publisher
Royalty
Edition
ISBN
a. Based on the dependency diagram, create a database whose tables are at least in 2NF, showing the
dependency diagram for each table.
b. Create a database whose tables are at least in 3NF, showing the dependency diagram for each table.
8. The dependency diagram in Figure Q6.8 indicates that a patient can receive many prescriptions for one or
more medicines over time. Based on the dependency diagram, create a database whose tables are in at least
2NF, showing the dependency diagram for each table.
Figure Q6.8 Prescription Dependency Diagram
MedName PatientID
Date
RefillsAllowed PatientName Dosage
Shelflife
Expert Solution
This question has been solved!
Explore an expertly crafted, step-by-step solution for a thorough understanding of key concepts.

This is a popular solution!

Trending now
This is a popular solution!

Step by step
Solved in 6 steps with 7 images

Knowledge Booster


Learn more about
Need a deep-dive on the concept behind this application? Look no further. Learn more about this topic, computer-science and related others by exploring similar questions and additional content below.Recommended textbooks for you
Database Systems: Design, Implementation, & Manag…
Computer Science
ISBN:
9781285196145
Author:
Steven, Steven Morris, Carlos Coronel, Carlos, Coronel, Carlos; Morris, Carlos Coronel and Steven Morris, Carlos Coronel; Steven Morris, Steven Morris; Carlos Coronel
Publisher:
Cengage Learning
Database Systems: Design, Implementation, & Manag…
Computer Science
ISBN:
9781285196145
Author:
Steven, Steven Morris, Carlos Coronel, Carlos, Coronel, Carlos; Morris, Carlos Coronel and Steven Morris, Carlos Coronel; Steven Morris, Steven Morris; Carlos Coronel
Publisher:
Cengage Learning