7. When we have a graph that shows a relationship besides linear, it is helpful to linearize it. This means we do some kind of calculation with the quantity on the horizontal axis of the original graph. Then, we make a new graph with the calculated quantity on the horizontal axis to try and make a graph with a linear shape. The calculation it takes to make a straight line will depend on the relationship the original graph shows: Shape of Original Graph New Horizontal Axis Linear Parabola Square root Inverse 1/x Inverse square 1/x To linearize your graph, what should go on your new horizontal axis? Hint: Replace "x" with the quantity that you plotted on your original horizontal axis. 12 1/1
7. When we have a graph that shows a relationship besides linear, it is helpful to linearize it. This means we do some kind of calculation with the quantity on the horizontal axis of the original graph. Then, we make a new graph with the calculated quantity on the horizontal axis to try and make a graph with a linear shape. The calculation it takes to make a straight line will depend on the relationship the original graph shows: Shape of Original Graph New Horizontal Axis Linear Parabola Square root Inverse 1/x Inverse square 1/x To linearize your graph, what should go on your new horizontal axis? Hint: Replace "x" with the quantity that you plotted on your original horizontal axis. 12 1/1

Related questions
Question
Pendulum Lab
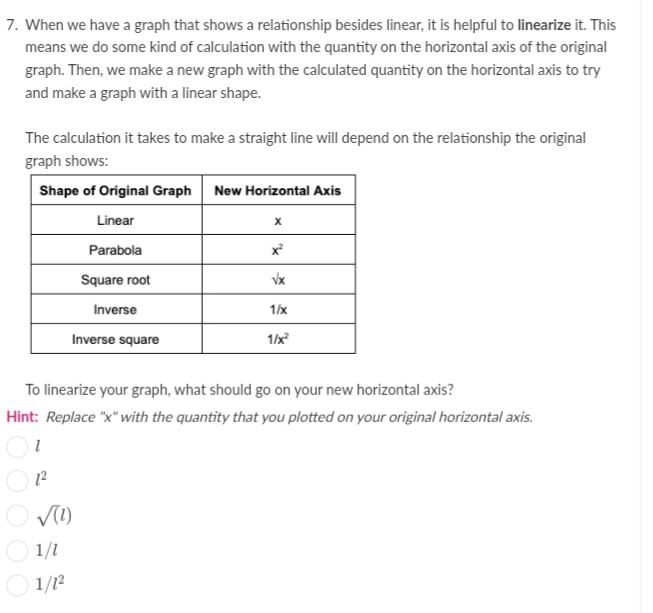
Transcribed Image Text:7. When we have a graph that shows a relationship besides linear, it is helpful to linearize it. This
means we do some kind of calculation with the quantity on the horizontal axis of the original
graph. Then, we make a new graph with the calculated quantity on the horizontal axis to try
and make a graph with a linear shape.
The calculation it takes to make a straight line will depend on the relationship the original
graph shows:
Shape of Original Graph New Horizontal Axis
Linear
Parabola
Square root
Inverse
1/x
Inverse square
1/x?
To linearize your graph, what should go on your new horizontal axis?
Hint: Replace "x" with the quantity that you plotted on your original horizontal axis.
12
1/1
1/12
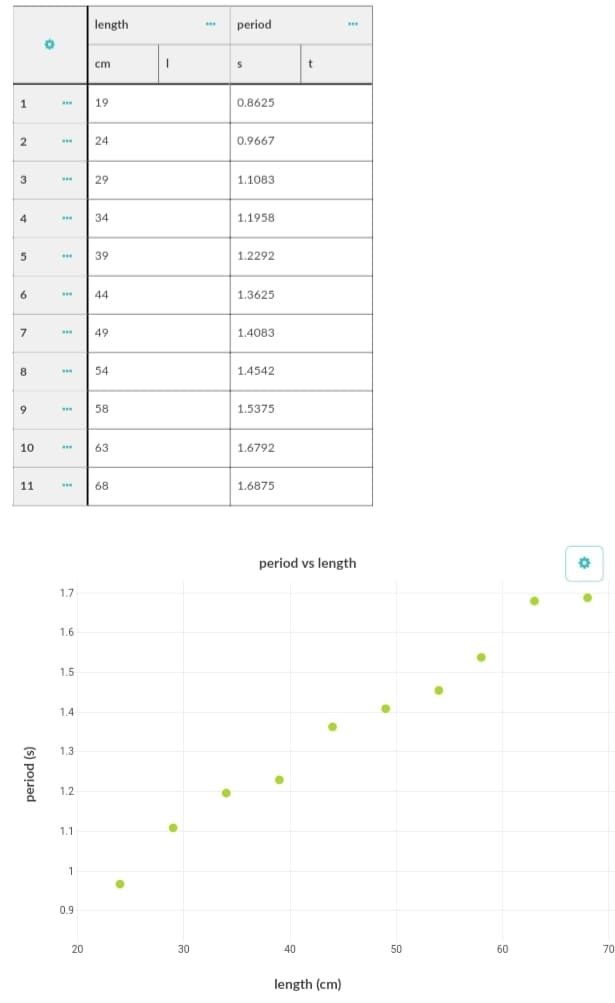
Transcribed Image Text:length
period
cm
t
1
19
0.8625
24
0.9667
...
3
29
1.1083
4
34
1.1958
39
1.2292
6
44
1.3625
7
49
1.4083
8
54
1.4542
9.
58
1.5375
10
63
1.6792
11
68
1.6875
period vs length
1.7
1.6
1.5
1.4
1.3
1.2
1.1
0.9
20
30
40
50
60
70
length (cm)
(s) pouad
Expert Solution
This question has been solved!
Explore an expertly crafted, step-by-step solution for a thorough understanding of key concepts.

This is a popular solution!

Trending now
This is a popular solution!

Step by step
Solved in 2 steps
