8. In this problem we develop the rudiments of the theory of linear regression. Suppose that associated with an experiment there are two random variables y and x. If the outcomes of severa] measurements of y and x are plotted on a two-dimensional graph, the result may look somewhat like that shown in Figure 4.6. These results could be effectively summarized by saying that y is approximately a linear func- tion of x. So y would be described by the equation y = a + bx which LEAST-SQUARES ESTIMATION is represented by the dashed line in the figure. A natural way to choose the appropriate dashed line is to choose that line which minimizes the total sum of the squared errors E, e;? where e, = y, – (a + bx) is the vertical distance between an observation point on the graph and the dashed line. Figure 4.6 Regression
8. In this problem we develop the rudiments of the theory of linear regression. Suppose that associated with an experiment there are two random variables y and x. If the outcomes of severa] measurements of y and x are plotted on a two-dimensional graph, the result may look somewhat like that shown in Figure 4.6. These results could be effectively summarized by saying that y is approximately a linear func- tion of x. So y would be described by the equation y = a + bx which LEAST-SQUARES ESTIMATION is represented by the dashed line in the figure. A natural way to choose the appropriate dashed line is to choose that line which minimizes the total sum of the squared errors E, e;? where e, = y, – (a + bx) is the vertical distance between an observation point on the graph and the dashed line. Figure 4.6 Regression

Linear Algebra: A Modern Introduction
4th Edition
ISBN:9781285463247
Author:David Poole
Publisher:David Poole
Chapter2: Systems Of Linear Equations
Section2.4: Applications
Problem 2EQ: 2. Suppose that in Example 2.27, 400 units of food A, 500 units of B, and 600 units of C are placed...

Related questions
Question
100%
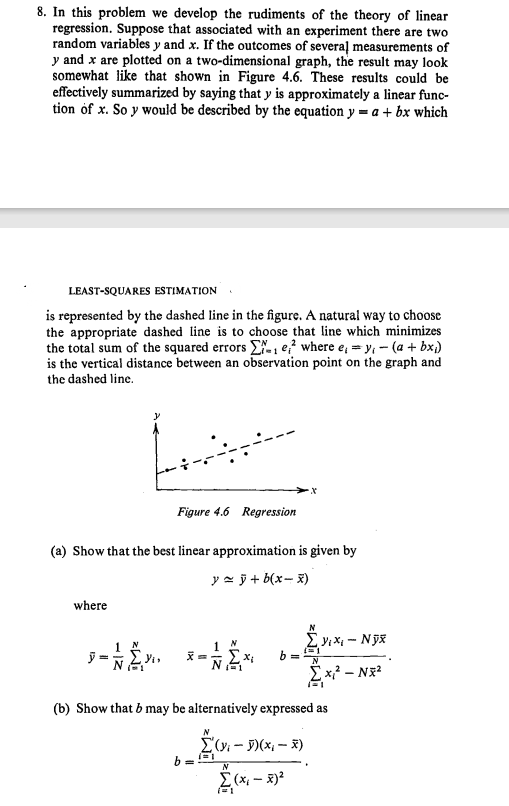
Transcribed Image Text:8. In this problem we develop the rudiments of the theory of linear
regression. Suppose that associated with an experiment there are two
random variables y and x. If the outcomes of severaļ measurements of
y and x are plotted on a two-dimensional graph, the result may look
somewhat like that shown in Figure 4.6. These results could be
effectively summarized by saying that y is approximately a linear func-
tion of x. So y would be described by the equation y = a + bx which
LEAST-SQUARES ESTIMATION.
is represented by the dashed line in the figure. A natural way to choose
the appropriate dashed line is to choose that line which minimizes
the total sum of the squared errors E, e;? where e, = y, - (a + bx;)
is the vertical distance between an observation point on the graph and
the dashed line.
Figure 4.6 Regression
(a) Show that the best linear approximation is given by
y = ỹ + b(x- x)
where
E* b=
y =
(b) Show that b may be alternatively expressed as
E(v - )(x – X)
N
Expert Solution
This question has been solved!
Explore an expertly crafted, step-by-step solution for a thorough understanding of key concepts.

Step by step
Solved in 2 steps with 2 images

Recommended textbooks for you
Linear Algebra: A Modern Introduction
Algebra
ISBN:
9781285463247
Author:
David Poole
Publisher:
Cengage Learning
Linear Algebra: A Modern Introduction
Algebra
ISBN:
9781285463247
Author:
David Poole
Publisher:
Cengage Learning